Executive Overview
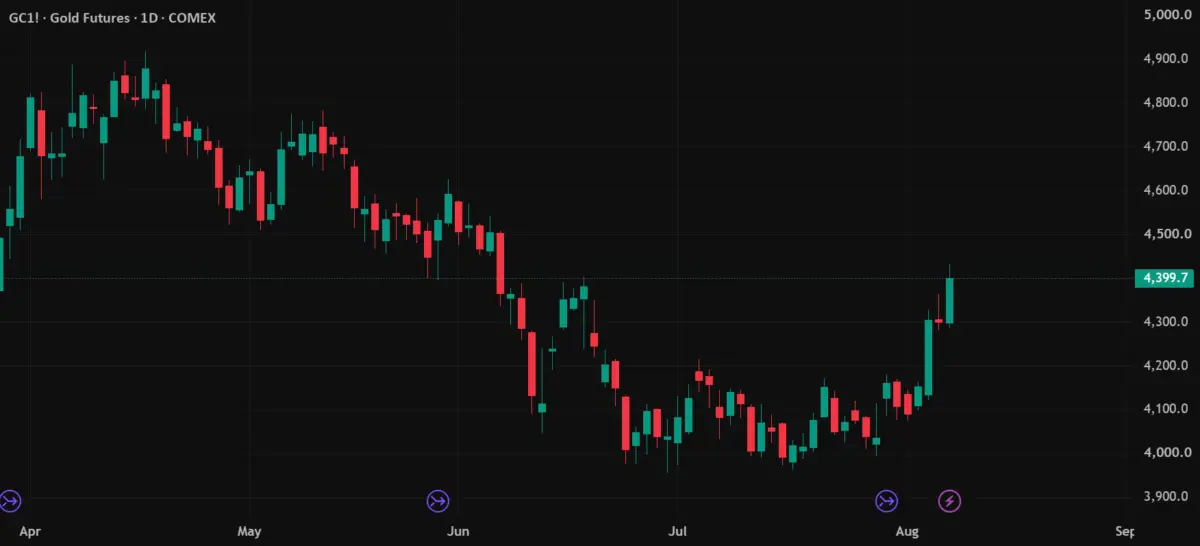
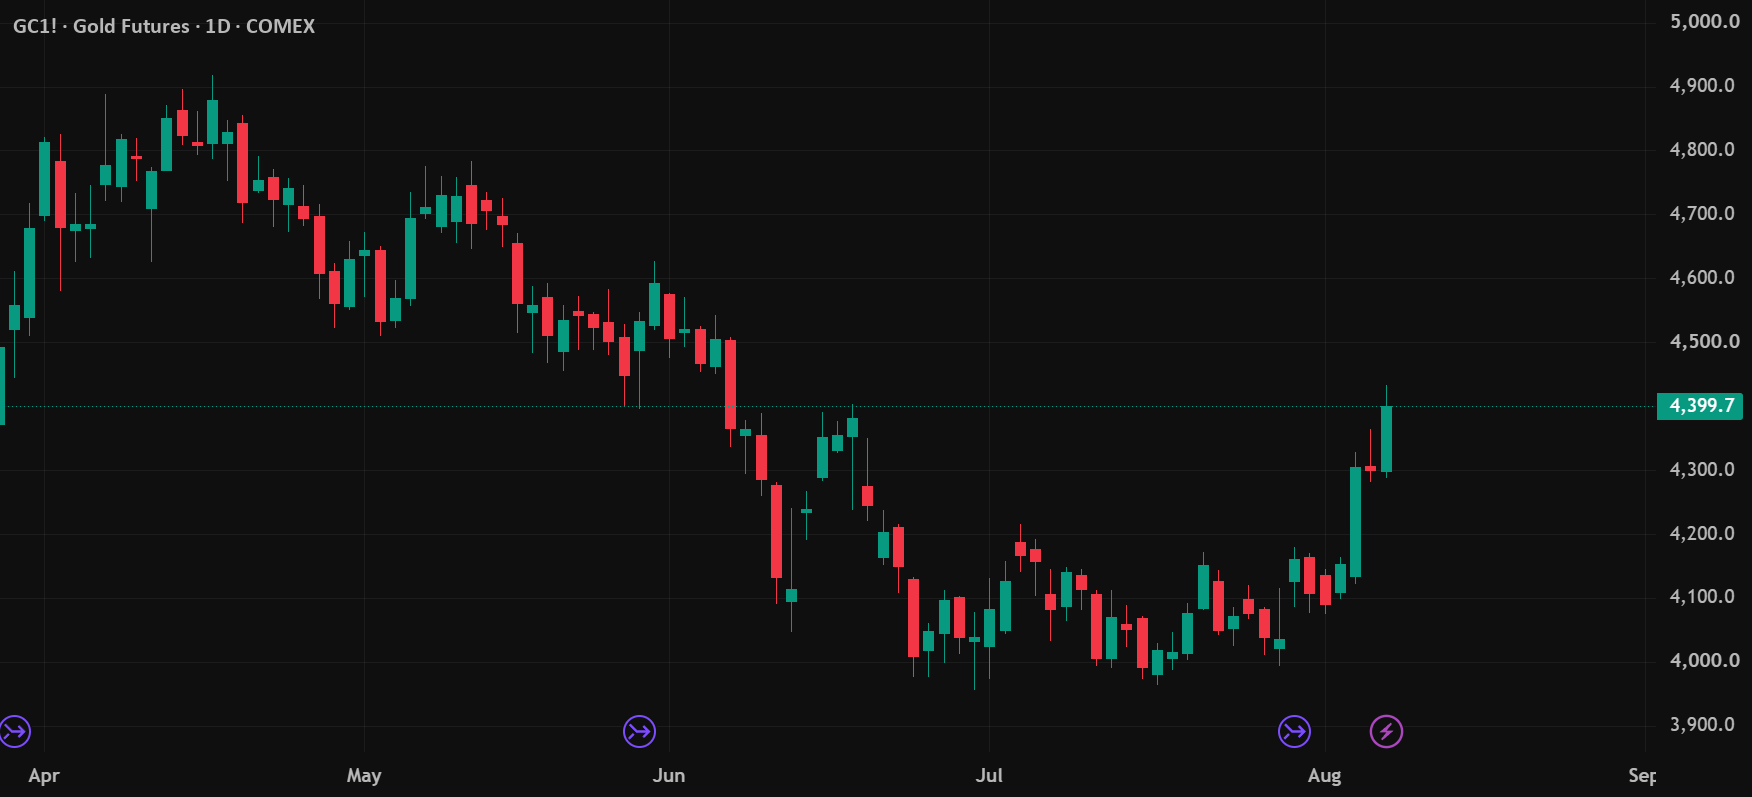
Consider a scenario where a proprietary, quantitative technical analysis panel evaluates gold through three distinct temporal lenses. On the monthly chart, the system flashes a high-conviction Strong Buy, anchoring a long-term bullish thesis with a projected 18% upside to an initial target of 5,194.98. Step down to the weekly chart, however, and the narrative abruptly fractures: the system prints a definitive Sell, projecting an immediate corrective pullback and a downside floor of 3,901.3. Drop down further to the daily timeframe, and the signal flips once more, returning a Strong Buy—yet accompanied by an abysmal reward-to-risk ratio of just 0.4, rendering the trade practically unviable.
Same system. Same underlying asset data. Opposite, contradictory conclusions.
For the uninitiated, this paradox induces cognitive dissonance, leading to forced decisions, emotional hedging, and catastrophic drawdowns. For the elite algorithmic trader, however, this fragmentation is not a system failure—it is the baseline state of market mechanics. This deep-dive investigative report examines the philosophy of multi-timeframe divergence, the physics of market measurement, the absolute supremacy of price action over ego, and the structural metrics required to survive when your own indicators refuse to agree.
Detailed Chronology: Anatomy of a Multi-Timeframe Divergence
To understand how a trading framework can simultaneously hold opposing views without descending into internal contradiction, one must inspect each timeframe in complete isolation. In advanced technical analysis, timeframes do not tell a single, continuous story; they speak entirely different languages governed by distinct behavioral rules.
The Monthly Horizon: The Home of the Macro Thesis
At the highest macro level, the monthly timeframe serves as the structural bedrock of a long-term position. It is slow, deliberate, and entirely immune to the emotional turbulence of daily headline noise.
Within the evaluated framework, the monthly chart registers a high-conviction Strong Buy.
- First Target: 5,194.98 (representing an approximate 18% appreciation from current levels).
- Reward-to-Risk Profile: Approximately 1.5.
- Structural Ceiling: Marked firmly at 5,626.8, sitting roughly 27.89% above current valuations.
Crucially, the monthly timeframe is the only analytical tier permitted to house the core macro thesis. Because it operates on a macro-structural scale, it is inherently incapable of timing granular entries. It does not pretend to offer precision; instead, it provides direction. It establishes the celestial coordinates toward which the asset is organically migrating over a multi-year horizon.
The Weekly Horizon: The Execution Arbiter Denies Entry
Stepping down one rung on the temporal ladder introduces the weekly timeframe—the arbiter of execution and structural pivot points. Here, the narrative reverses sharply.
The system prints a Sell, with the aggregate reading tilting into negative territory.
- First Target: Situated well beneath current market pricing.
- Structural Floor: Marked at 3,901.3, representing a downside distance of 11.33%.
This divergence between the monthly buy and the weekly sell is neither a contradiction nor a refutation of the macro thesis. Rather, it is a statement of timing. A long-term investor or position trader is structurally permitted—and frequently required—to sit through a painful weekly pullback to preserve a monthly thesis. What a disciplined trader is never allowed to do, however, is rewrite historical context after the fact, retroactively pretending the weekly chart supported the monthly narrative all along.
The Daily Horizon: The Illusion of Correctness
Dropping down to the daily chart reveals the final piece of the analytical puzzle—and delivers the most critical lesson in risk management.
The system flashes a Strong Buy once again.
- First Target: 4,492.3.
- Distance to Target: A mere 2.1%.
- Reward-to-Risk Ratio: A disastrous 0.4.
Read that metric again: 0.4. This single figure exposes the chasm between being directionally correct and financially profitable. A reward-to-risk ratio of 0.4 means a trader must risk more than twice what they stand to make. The daily chart identifies the correct direction of the broader trend, but packages it into a mathematically garbage trade. In professional trading, "correct" and "profitable" are entirely separate vocabularies.
Supporting Context & Metrics: The Physics of Market Measurement
Why do these timeframes fundamentally disagree, and why is that state of perpetual tension actually normal? To answer this, quantitative analysts often draw parallels to physical sciences—specifically, quantum mechanics.
The Heisenberg Uncertainty Principle of Charts
In quantum physics, measuring the precise position of a particle destroys precision regarding its momentum; both variables cannot be sharply defined at the exact same instant. Financial charts behave in an identical manner.
- The more precisely a trader attempts to time an entry, the shorter the analytical window they must measure. Consequently, that micro-window loses all capacity to speak meaningfully about a broader macro trend.
- Conversely, the more confident an analyst wishes to be regarding a macro trend, the longer the required observational window—which simultaneously obliterates entry timing precision.
A monthly up-signal, a weekly down-signal, and a daily up-signal simply represent three distinct measurement bases returning three mathematically valid answers simultaneously. Collapsing these independent variables prematurely—picking one branch because holding cognitive dissonance feels uncomfortable—is the primary catalyst behind catastrophic retail trading losses. Traders who force binary clarity out of a complex system inevitably spend weeks defending an unviable position.
The Significance of 10,000 Ticks
In professional commodity analysis, distinguishing between structural trends and high-frequency noise is non-negotiable. Any price action operating under a threshold of 10,000 ticks is classified strictly as scalping, not trend-following.
On the COMEX Gold (GC) futures contract, for instance, a single tick represents $0.10 per ounce. Therefore, a 10,000-tick move equates to roughly $1,000 per ounce of price travel.
- Below this specific distance threshold, indicators are merely measuring noise dressed up in favorable visual aesthetics.
- Above this threshold, authentic market structure must exist, because underlying capital cannot traverse that vast distance without leaving institutional footprints detailing who was buying, how much, and where.
Official Statements & Methodological Frameworks
To maintain an unyielding edge, elite market operators rely on strict structural definitions and correlated asset confirmations rather than emotional gut feelings.
1. Never Read Gold in Isolation
Precious metals do not exist in a vacuum. Analyzing gold while ignoring silver, copper, platinum, and palladium is a fatal analytical error. Correlated systems share vital systemic information; measuring one asset provides immediate probabilistic insight into the health of the others.
- When the entire metals complex moves in unison, the underlying price action possesses institutional body and momentum.
- When gold stages an aggressive run while silver and copper decisively lag or refuse to participate, the structural correlation has fractured. This breakdown serves as the earliest, most reliable warning signal available to technical analysts.
2. The Supremacy of Interest Rates
Price action cannot be interpreted in isolation from the cost of capital. If an analyst were forced to discard every macroeconomic data point save for one, the logical choice is interest rates. Precious metals are fundamentally priced against the opportunity cost of holding cash. This single macroeconomic relationship explains more anomalous gold behavior than any complex technical oscillator ever devised. Furthermore, a professional trading system must be explicitly programmed to say nothing when inputs conflict. A system that relentlessly generates opinions regardless of market ambiguity is not confident; it is fundamentally flawed.
3. Defining an Observation: Closes vs. Touches
Amateur traders trade on "touches"—entering a position the moment price grazes a historical support or resistance level. Professional frameworks operate exclusively on closes.
A touch is merely an unverified rumor. A close is a certified observation. A disciplined operator waits for a reclaim close: definitive evidence of price closing back above or below a critical level, proving that institutional buyers or sellers have won the battle rather than merely expressing hope. Combined with a mandatory minimum 2:1 reward-to-risk filter, this observation standard filters out the mathematically compromised setups that drain retail trading accounts.
Future Outlook: The Conditions That Invalidate the Thesis
A robust analytical framework is defined not just by how it enters trades, but by how it gracefully surrenders when proven wrong. A trading thesis devoid of a clear, pre-determined exit condition is not a thesis—it is an expensive wish.
For the multi-temporal gold matrix outlined above, the entire bullish monthly thesis remains intact only as long as specific structural boundaries are respected. The thesis is instantly invalidated and marked down upon the occurrence of either of the following two market observations:
- A confirmed weekly close that decisively loses the foundational price level from which the macro move originally launched.
- A structural decoupling of the metals complex, characterized by gold pushing higher while correlated industrial metals like silver and copper fracture and split apart.
Until either of these falsification events materializes, probability matrices remain open. The market retains absolute sovereignty; the model remains secondary. By embracing multi-timeframe divergence rather than fighting it, disciplined operators transform the inherent chaos of financial markets into a calculated, mathematically sound operational advantage.
Disclaimer: The frameworks, metrics, and analyses detailed in this report are strictly for educational and informational purposes and do not constitute financial advice. All trading decisions, entries, exits, and risk management strategies remain the sole responsibility of the individual reader.