Executive Overview
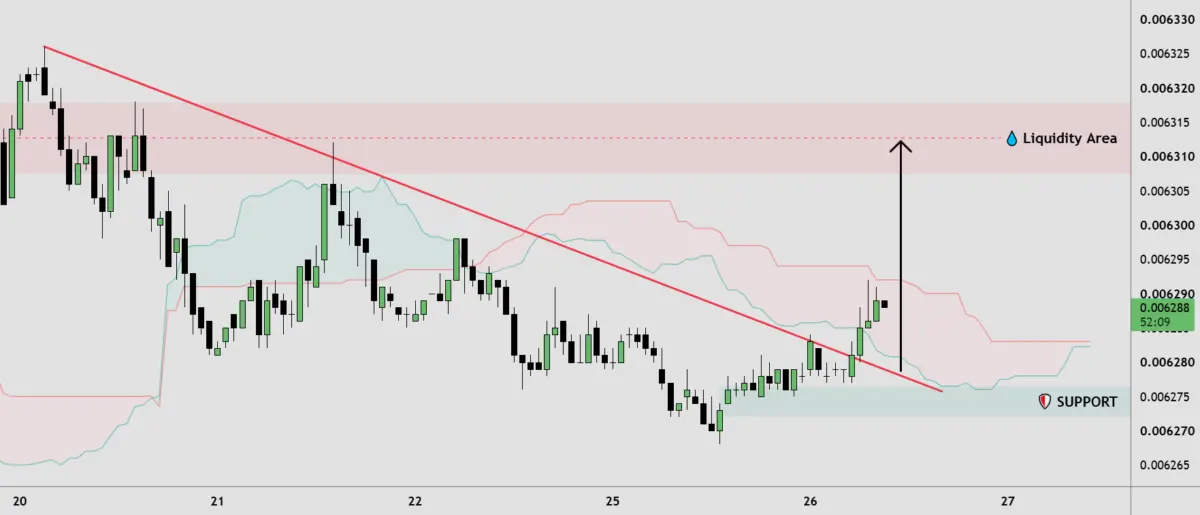
Recent price action highlights a notable technical reaction from a crucial support zone situated between 0.00627 and 0.00628. This rebound has ignited a short-term bullish push, driving the exchange rate directly toward a persistent falling trendline that has capped upward mobility for weeks. As the market tests this formidable barrier, participants are weighing the probability of a structural trend reversal against the risk of a continuation of the broader historical downtrend.
Simultaneously, the psychological and liquidity dynamics surrounding the upper resistance zone—specifically 0.00631 to 0.00632—are presenting a high-stakes scenario for short-term and swing traders. Should the pair manage a confirmed, sustained break above the descending trendline, bullish momentum could accelerate rapidly toward this primary liquidity pocket. Conversely, any sign of exhaustion or rejection at this technical ceiling could reinforce the overarching bearish market architecture, inviting renewed selling pressure that threatens to retest foundational support tiers.
This comprehensive analysis explores the multifaceted dimensions of the current JPY/USD market environment. By examining the precise technical chronology, macroeconomic backdrops, risk management frameworks, and expert trading methodologies, this report aims to provide market participants with an authoritative and thorough evaluation of the currency pair’s near-term trajectory.
Detailed Chronology: Technical Progression and Price Action Analysis
To understand where the JPY/USD exchange rate is heading, one must meticulously trace the evolution of its recent price action. Technical analysis relies on the premise that history often rhymes within price charts, mapping out the behavioral patterns of market participants reacting to macroeconomic data releases, liquidity shifts, and sentiment changes.
The Macro Descending Structure
For an extended duration, the JPY/USD pair has been governed by a broader descending structure. This architectural trend is visually and mathematically defined by a clear sequence of lower highs and lower lows. Every attempted recovery by the Yen against the greenback has systematically met exhaustion at progressively lower price thresholds, while sell-offs have repeatedly breached preceding floor levels. This structural integrity has been anchored by a falling trendline acting as an impenetrable ceiling for bullish ambitions.
Within this overarching downtrend, market participants have observed periods of consolidation interrupted by sharp liquidations. The dominance of the descending structure reflects persistent fundamental headwinds facing the Japanese currency, compounded by the relative attractiveness of US dollar-denominated yields. However, technical markets rarely move in straight lines; even the most robust trends undergo corrective phases, consolidation ranges, and tactical counter-trend rallies.
The Support Reaction: 0.00627 – 0.00628
The most recent chapter in this technical saga began as the JPY/USD approached a deeply significant historical liquidity and support zone spanning 0.00627 to 0.00628. In technical analysis, support zones represent regions where concentrated buying interest historically overcomes selling pressure, halting declines and prompting algorithmic or discretionary accumulation.
As price drifted into this targeted band, selling momentum noticeably decelerated. Order book depth metrics indicated a clustering of limit buy orders, absorbing the lingering supply from short-sellers. This resulted in a classic technical reaction: a swift rejection of lower prices accompanied by an influx of short-term buying volume. This reaction validated the 0.00627–0.00628 band as a vital psychological and mechanical floor, at least for the immediate term.
The Current Test: Pressing the Trendline
Following the successful defense of the support zone, the JPY/USD initiated a decisive short-term bullish push. Rather than entering a sluggish consolidation phase, buyers stepped in aggressively, driving the exchange rate upward through interim intraday resistance levels.
Currently, price action is directly testing the falling trendline that has defined the broader descending structure. This moment represents a critical tactical crossroads. When a market grinds upward into a descending trendline following a support bounce, it typically triggers two distinct behavioral responses among traders:
- Breakout Anticipation: Momentum traders and aggressive buyers begin positioning for an upside violation, betting that the weight of the repeated tests has exhausted the available supply along the trendline.
- Trend Continuation Defense: Swing traders and macro bears prepare to defend the structural ceiling, looking for bearish candlestick formations, volume spikes, or rejection wicks to initiate short positions in alignment with the larger downtrend.
The Upper Liquidity and Resistance Zone: 0.00631 – 0.00632
Directly hovering above the current trendline test is a visible liquidity area and nearby resistance zone demarcated between 0.00631 and 0.00632. In modern electronic markets, liquidity areas are clusters of resting stop-loss orders and limit orders where institutional execution desks frequently seek counterparties to fill large orders.
If the JPY/USD successfully breaches the falling trendline, algorithmic momentum programs are likely to target this 0.00631–0.00632 region. However, this zone is not merely a magnet; it is also a formidable barrier. The concentration of selling pressure expected here stems from trapped shorts looking to exit at breakeven and new sellers entering the market with favorable risk-to-reward ratios. Consequently, the interaction between price action and this upper zone will dictate whether a breakout is genuine or merely a temporary deviation.
Supporting Context & Metrics: Macro Drivers and Market Mechanics
Technical analysis does not exist in a vacuum. To fully appreciate the significance of the 0.00627–0.00628 support zone and the 0.00631–0.00632 resistance barrier, one must contextualize the macroeconomic environment governing both the Japanese Yen and the US Dollar.
Monetary Policy Divergence: BoJ vs. Fed
At the heart of the JPY/USD valuation dynamic lies the divergence in monetary policy between the Bank of Japan (BoJ) and the United States Federal Reserve (Fed). For years, the BoJ maintained an ultra-loose monetary policy stance, characterized by negative interest rates and Yield Curve Control (YCC), designed to stimulate domestic inflation and economic growth. Although the BoJ has recently taken historic steps toward normalization—abandoning negative interest rates and signaling a gradual shift away from aggressive stimulus—the pace of policy tightening remains exceptionally cautious compared to its global peers.
Conversely, the Federal Reserve’s aggressive interest rate hiking cycle over recent years established a profound yield differential between US Treasuries and Japanese Government Bonds (JGBs). Even as market expectations pivot toward potential rate cuts by the Fed, the absolute yield spread remains wide enough to incentivize capital flight out of yen-denominated assets and into high-yielding dollar instruments. This fundamental carry-trade mechanism has consistently weighed on the Japanese Yen, reinforcing the broader descending technical structure observed on the charts.
Liquidity, Order Flow, and Market Depth
Understanding the structural significance of liquidity areas requires a closer look at how modern foreign exchange markets operate. Liquidity is the lifeblood of currency trading; it represents the ease with which an asset can be bought or sold without causing drastic price fluctuations.
In the JPY/USD market, liquidity is heavily concentrated around institutional execution sessions, notably the overlap between the European and North American trading windows. During these periods, order books deepen, allowing large market participants to execute substantial volume.
The identified zones—0.00627–0.00628 for support and 0.00631–0.00632 for resistance—are not arbitrary lines drawn on a chart. They represent historical inflection points where large institutional orders were previously absorbed or executed. When price approaches these zones, order flow dynamics shift. Limit orders accumulate, resting stop orders are triggered, and market makers adjust their quotes to manage inventory risk. Recognizing these mechanical realities helps traders differentiate between authentic structural shifts and market "noise" or stop-hunts designed to trap retail participants.
Strategic Scenarios and Risk Management Frameworks
Navigating a technical crossroad requires disciplined scenario planning. Rather than attempting to predict the future with absolute certainty, professional traders evaluate probabilistic outcomes and construct contingency plans for every plausible market development. Based on current price action, two primary scenarios emerge for the JPY/USD.
Scenario A: The Bullish Breakout and Retest
If buying momentum persists and the JPY/USD confirms a sustained break above the descending trendline, the immediate technical bias shifts to the upside.
- Execution Strategy: Prudent traders rarely buy a breakout the exact moment it crosses a trendline, as false breakouts (or "bull traps") are a common occurrence in volatile forex markets. Instead, a more disciplined approach involves waiting for price confirmation—such as a strong four-hour or daily close above the trendline—followed by a successful retest of the broken trendline acting as new support.
- Target Objective: Upon a confirmed retest and bounce, bullish momentum could rapidly propel the exchange rate toward the highlighted upper liquidity and resistance area at 0.00631–0.00632.
- Risk Management: Stop-loss orders in this scenario are typically placed just beneath the structural swing low formed during the retest phase, ensuring that if the breakout fails, capital is preserved with minimal drawdown.
Scenario B: Trendline Rejection and Bearish Continuation
Given the weight of the broader descending structure, a rejection from the falling trendline remains a highly probable outcome.
- Execution Strategy: If price action exhibits signs of stalling—such as long upper shadows (wicks) on candlestick charts, declining volume on the push toward the trendline, or a sharp bearish engulfing candle—market participants may interpret this as a rejection. This validates the continuation of the overarching bearish market structure.
- Target Objective: A rejection from the trendline puts the nearby support zone of 0.00627–0.00628 back into focus. If selling pressure intensifies and results in a decisive break below this support floor, the short-term bullish structure will be severely compromised. This shift in market structure would direct institutional and retail attention toward lower support levels not yet factored into the immediate range.
- Risk Management: Short positions initiated upon a trendline rejection would typically place stop-loss orders just above the most recent swing high or above the descending trendline, maintaining a favorable risk-to-reward ratio relative to the target support zone.
Future Outlook: Macroeconomic Catalysts and Technical Trajectories
As we look toward the medium and long-term horizon for the JPY/USD exchange rate, several critical variables will dictate whether the currency pair escapes its historical descending channel or remains locked within its established parameters.
Upcoming Economic Data Releases
Foreign exchange markets are hyper-sensitive to incoming macroeconomic data. In the weeks ahead, market participants will be closely scrutinizing key economic indicators from both Japan and the United States:
- Inflation Metrics: Japanese consumer price index (CPI) prints will heavily influence expectations regarding the Bank of Japan’s future policy path. Persistent inflation above the BoJ’s target could accelerate normalization timelines, providing fundamental tailwinds for the Yen.
- US Labor and Growth Data: Non-Farm Payrolls (NFP), Gross Domestic Product (GDP) growth figures, and core PCE inflation data from the US will dictate the trajectory of Federal Reserve policy expectations. Softer US data could compress the yield differential, weakening the US Dollar and offering relief to the JPY/USD pair.
- Geopolitical Developments: Safe-haven flows remain a wildcard for the Japanese Yen. In times of global geopolitical uncertainty or financial market instability, the Yen has historically attracted safe-haven capital inflows, occasionally overriding pure monetary policy differentials.
Technical Evolution Over the Medium Term
From a purely technical perspective, the ongoing test of the descending trendline is merely the opening salvo in a larger structural battle. Even if the JPY/USD achieves a successful breakout and reaches the 0.00631–0.00632 resistance zone, overcoming that upper barrier will require sustained volume and a fundamental shift in macro sentiment.
Long-term trend reversals do not happen overnight; they require a gradual transition from lower lows and lower highs to higher highs and higher lows. Whether the current bounce from the 0.00627–0.00628 support zone marks the inception of such a structural transformation or merely another lower high within a relentless macro downtrend will be answered by how price action reacts to key liquidity zones in the sessions ahead.
Disclaimer and Educational Notice
This comprehensive analysis is provided for educational, informational, and analytical purposes only and does not constitute financial, investment, trading, or legal advice. Foreign exchange trading carries a high level of risk and may not be suitable for all investors. The high degree of leverage can work against you as well as for you. Before deciding to trade foreign exchange, you should carefully consider your investment objectives, level of experience, and risk appetite.
The information, charts, and publications provided herein are not meant to be, and do not constitute, financial, investment, trading, or other types of advice or recommendations supplied or endorsed by TradingView or any affiliated financial entities. Market structures, liquidity zones, and technical indicators are subject to rapid change based on real-time order flow and macroeconomic developments. Always conduct your own independent research, consult with a qualified licensed financial advisor, and utilize robust risk management protocols before making any trading decisions.