Executive Overview
As astute market participants look for generational entry points, attention is once again turning toward time-tested technical indicators, such as the Pi Cycle Top indicator, to map out the next major market cycle. This report provides an exhaustive investigative analysis of the current market structure, evaluating whether the recent months of consolidation represent a structural breakdown or an unprecedented accumulation opportunity for long-term investors. By examining historical chart patterns, macroeconomic influences, quantitative metrics, and expert market sentiment, we dissect the shifting dynamics of modern asset classes and explore what the data reveals about the road ahead.
Detailed Chronology of Recent Market Movements
To understand where the market is heading, one must first trace the precise trajectory of price action that has led to the current juncture. The past several quarters have been characterized by sharp deviations from long-term moving averages, testing the emotional resolve of even the most seasoned market participants.
The Peak and the Premature Panic
The seeds of the current debate were sown during the dramatic highs that marked the conclusion of the previous aggressive upward cycle. As valuations reached euphoric levels, momentum-driven buyers flooded the market, pushing asset prices into overextended territory. However, parabolic ascents are inherently unsustainable. When macroeconomic pressures—ranging from shifting central bank monetary policies to localized liquidity crunches—began to mount, the market experienced a sharp, sudden contraction.
During this contractionary phase, panic selling dominated the order books. Social media sentiment boards and trading communities lit up with bearish forecasts, with many analysts prematurely declaring the arrival of a multi-year bear market. Leveraged long positions were liquidated in cascading waves, creating an exaggerated sense of structural damage across various exchanges.
The Consolidation Phase and Accumulation
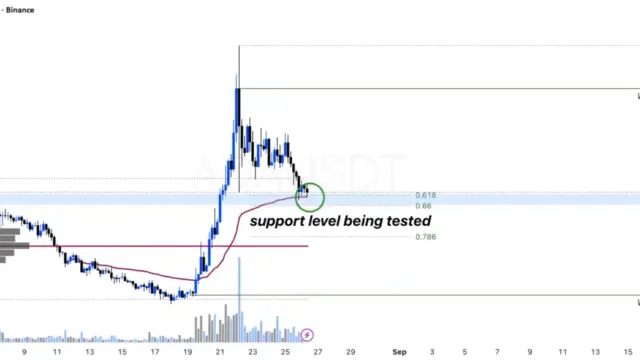
Following the initial flush-out, the market entered a prolonged period of sideways consolidation. Rather than breaking down into a deeper, prolonged winter, asset prices found robust support at key historical demand zones. During this multi-month consolidation window, smart money and patient retail investors—often referred to in trading vernacular as "bulls who have laddered"—began methodically accumulating positions.
This phase of the cycle is historically critical. It separates reactive emotional traders from strategic, data-driven participants. By steadily scaling into positions rather than deploying capital all at once, these accumulators mitigated downside risk while positioning themselves for an eventual trend continuation. As price action began to stabilize and form higher lows, the hypothesis that the preceding downturn was merely a volatile correction—rather than a secular bear market—began to gather empirical weight.
Supporting Context & Metrics: Technical Indicators and Historical Parallels
In technical analysis, history rarely repeats itself identically, but it frequently rhymes. Examining the underlying mechanics of past market cycles provides essential context for evaluating current chart structures.
The Anatomy of a Healthy Correction
A true bear market is typically defined by a structural shift in macroeconomic fundamentals, characterized by declining adoption, sustained macroeconomic contraction, and a prolonged destruction of capital that can last for years. Conversely, a macro correction within a broader secular bull market is defined by a sharp, temporary retracement designed to shake out weak hands, reset overleveraged derivatives markets, and redistribute capital from short-term speculators to long-term holders.
An analysis of recent volume profiles and on-chain metrics reveals that the recent multi-month dip lacked the structural hallmarks of a true bear market. Exchange reserves have continued to decline—a sign that investors are moving assets into cold storage rather than preparing to dump them on the open market. Furthermore, network growth and fundamental utilization metrics have remained remarkably resilient, contrasting sharply with the network stagnation typical of historical bear markets.
The Reliability of the Pi Cycle Top Indicator
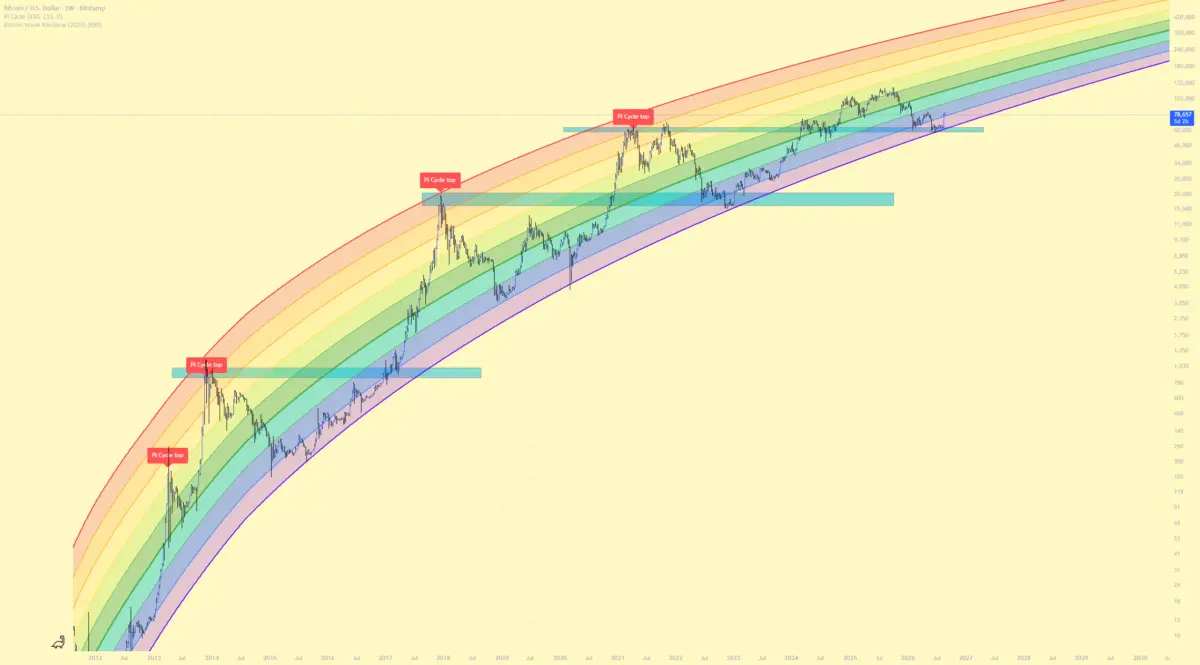
As market participants gaze upward toward potential new price discoveries, technical analysts are increasingly relying on proven mathematical models to identify cycle inflection points. Among these, the Pi Cycle Top indicator has earned a legendary reputation for its historical accuracy in forecasting major market peaks.
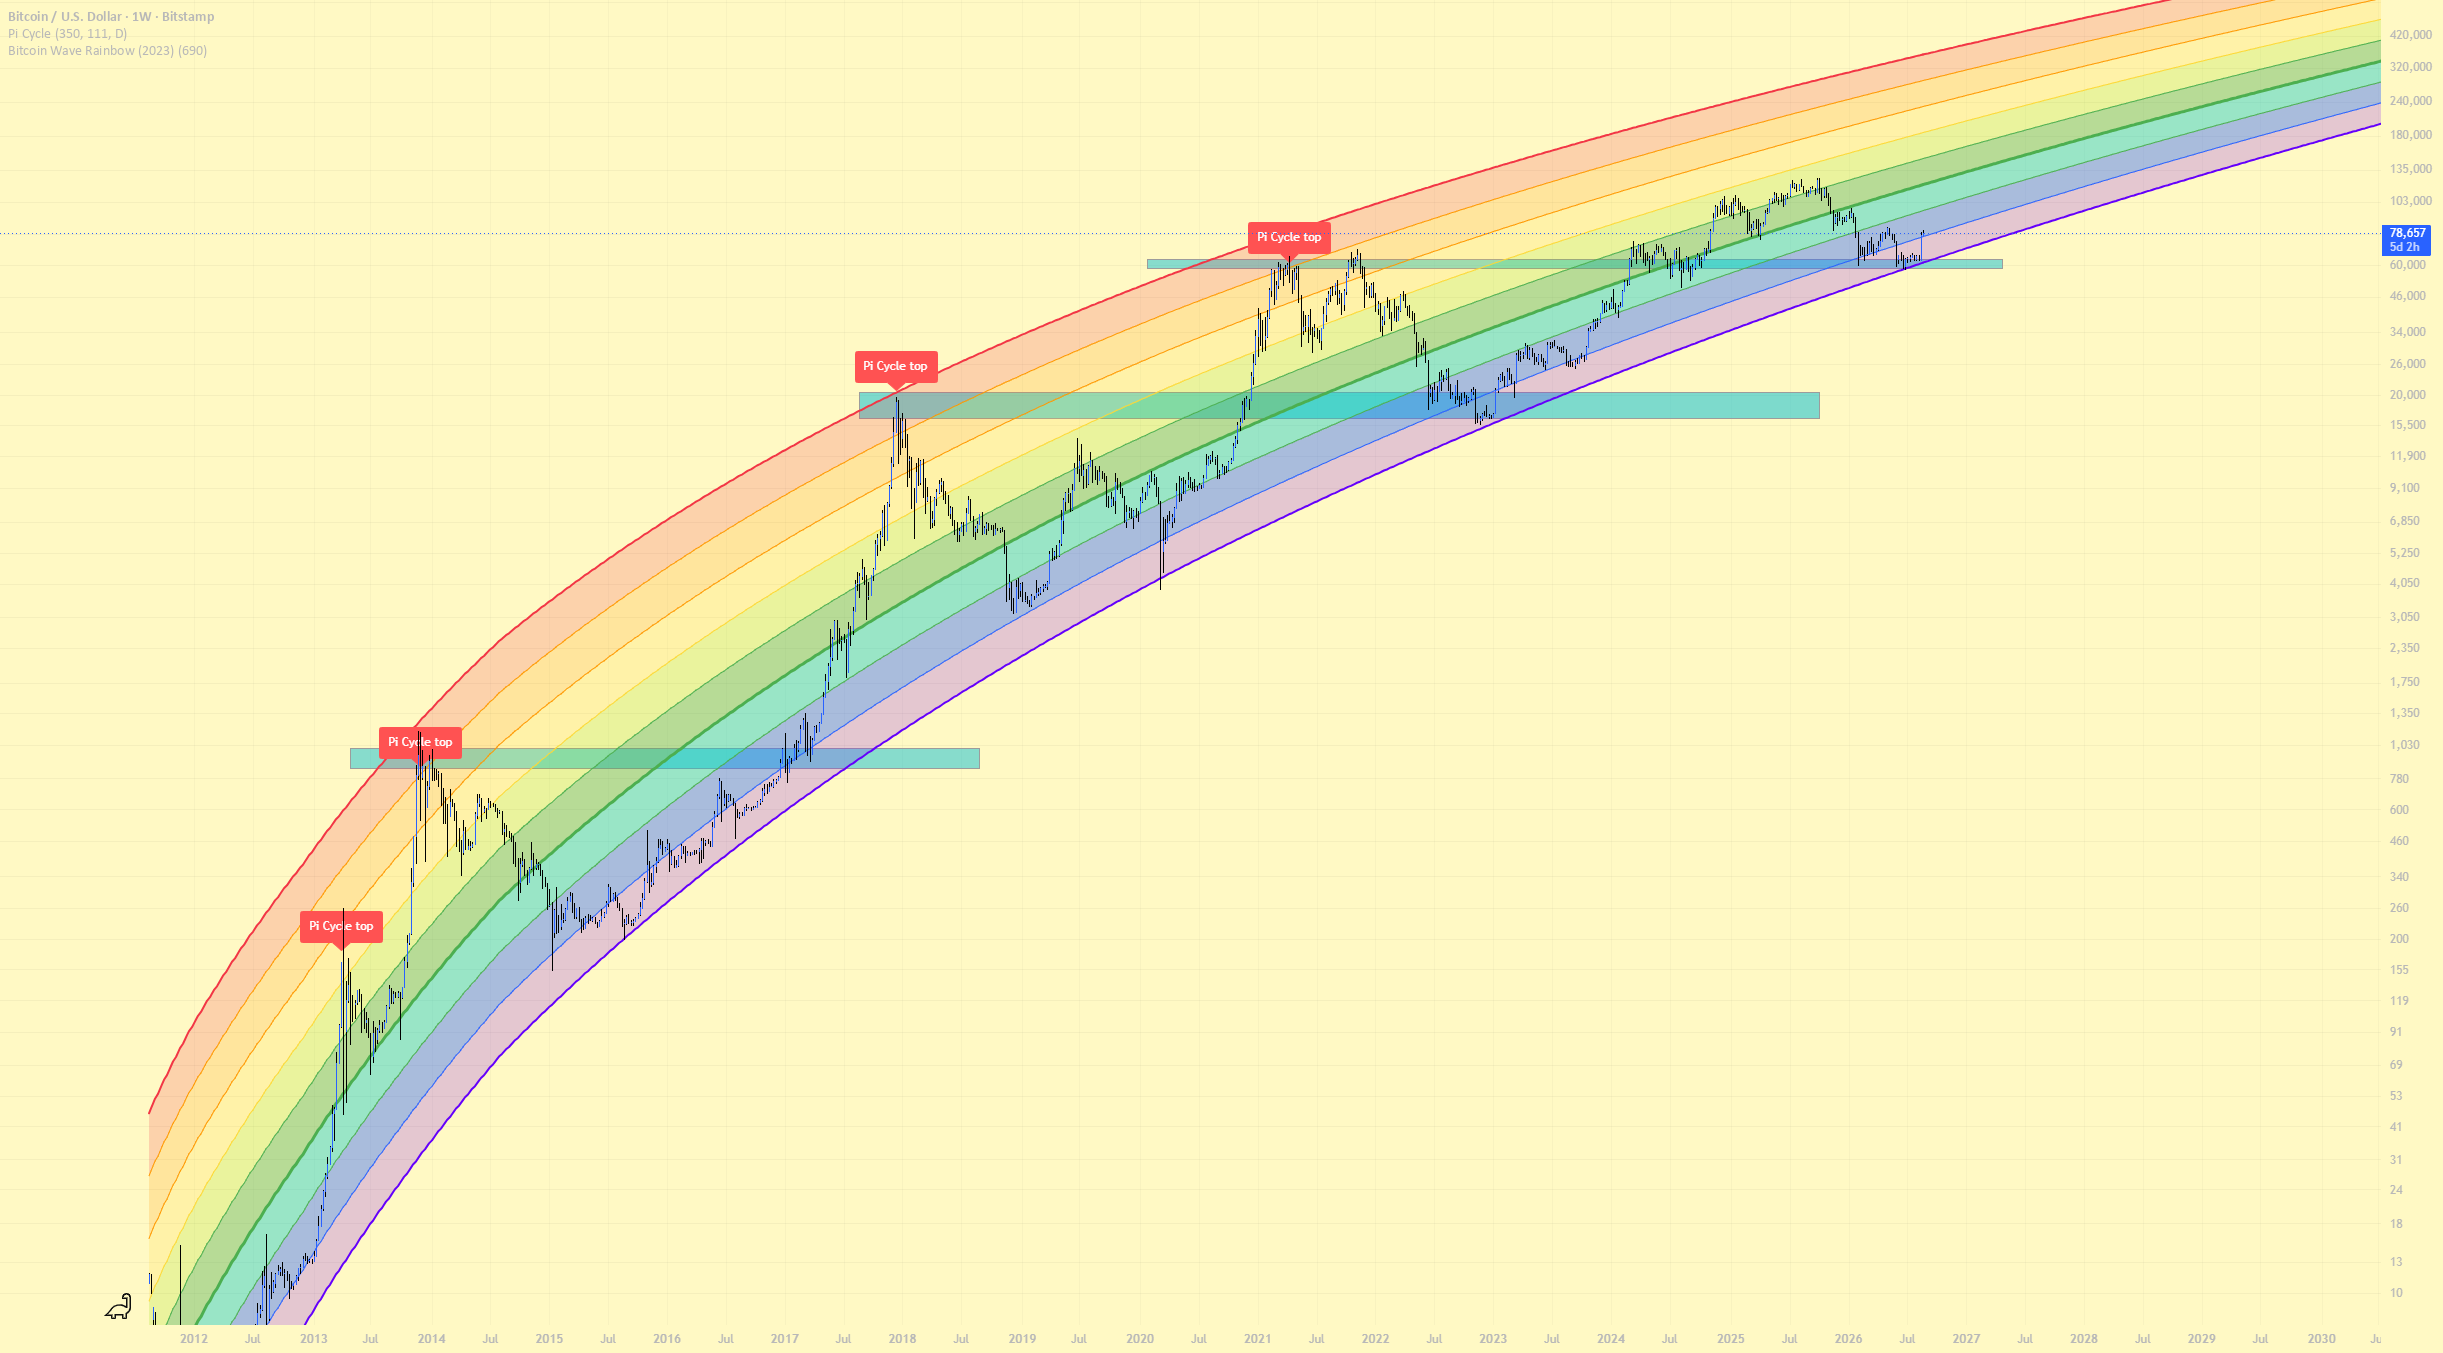
Originally developed to identify structural exhaustion points by observing the crossover of moving averages derived from mathematical constants (specifically multiples associated with Pi), the indicator has reliably signaled macro tops across multiple market cycles with remarkable precision. As prices begin to recover and push toward previous resistance levels, market participants are keeping a watchful eye on the Pi signal. If history holds true, this indicator will serve as the ultimate compass for timing the exit of the impending bullish expansion, ensuring that disciplined investors can secure profits before the inevitable cyclical contraction begins.
Expert Commentary and Official Market Perspectives
Navigating complex financial landscapes requires listening closely to the institutional and independent voices shaping market consensus. While the media often amplifies panic during downturns, professional analysts emphasize the importance of structural objectivity.
The Institutional View on Market Cycles
Institutional research desks have increasingly adopted a cyclical view of asset performance, noting that modern markets are maturing rapidly. According to several leading market strategists, the integration of traditional financial instruments into alternative asset classes has altered the velocity of market corrections.
"What retail investors perceive as catastrophic volatility is frequently just the natural friction of a market scaling to new institutional heights," notes one senior market analyst at a prominent digital asset fund. "When you look at the macro liquidity trends and the depth of the order books during recent dips, it becomes clear that institutional accumulation is acting as a hard floor for prices. Calling the last few months a bear market ignores the fundamental supply-and-mortar mechanics currently at play."
The Retail Perspective and Tactical Execution
From the grassroots perspective of independent chart analysts and community-driven platforms, the sentiment is overwhelmingly optimistic. Contributors across premier charting networks have emphasized the beauty of the current technical formations. By utilizing disciplined strategies such as "laddering"—entering fractional positions systematically across downward price bands—retail traders have positioned themselves to reap disproportionate rewards as the market trend reverses.
These independent analysts argue that the psychological wear-and-tear of the correction was intentionally designed by market makers to induce capitulation. Those who resisted the psychological pressure and maintained a long-term macro perspective are now poised to benefit from the impending upward expansion.
Future Outlook: Navigating the Road Ahead
As the financial landscape transitions from a period of consolidation to a renewed phase of expansion, market participants must remain vigilant, disciplined, and focused on risk management.
Anticipating the Next Upward Impulsion
The convergence of supportive technical patterns, robust historical precedents, and renewed buying pressure suggests that the market is primed for a significant bullish impulse. If the historical rhythm of previous cycles is maintained, the coming months could witness aggressive price discovery phases that catch under-positioned bears off guard.
However, navigating this environment requires more than blind optimism. Investors must remain cognizant of external macroeconomic variables, including regulatory developments, shifts in global liquidity, and broader macroeconomic data releases that could temporarily disrupt technical momentum.
Strategic Recommendations for Market Participants
- Maintain Macro Perspective: Do not allow short-term volatility or sensationalized headlines to distort your view of the broader structural trend. Differentiate between routine corrections and systemic market failures.
- Rely on Proven Indicators: Utilize data-driven tools such as the Pi Cycle Top indicator and moving average crossovers to remove emotion from your exit strategies, avoiding the trap of emotional greed at cycle peaks.
- Practice Disciplined Risk Management: Whether you are scaling into positions via laddered orders or managing existing portfolios, ensure that your exposure aligns with your long-term financial risk tolerance.
Conclusion
The debate between bulls and bears is as old as financial markets themselves. Yet, as the dust settles on the recent period of market volatility, the evidence increasingly favors those who viewed the downturn not as a secular bear market, but as a robust, healthy correction within a larger secular trend. With technical indicators signaling potential upside, historical parallels pointing toward renewed expansion, and patient accumulators preparing to reap their rewards, the market stands at the precipice of its next great chapter. As always, those who respect the data, honor risk management protocols, and keep a cool head will be best positioned to navigate whatever the charts unveil next.
Disclaimer: The information and publications provided in this article are for informational and educational purposes only and do not constitute financial, investment, trading, or other types of advice or recommendations supplied, endorsed, or validated by publishing platforms or financial institutions. Always conduct thorough independent research and consult with a licensed financial advisor before making any investment decisions.