Executive Overview
However, a deeper, more granular investigation into the fundamental realities of the physical oil market reveals a striking divergence. While derivative traders and paper markets are heavily discounting geopolitical risk premiums, the actual physical supply-demand balance remains markedly tighter than current price action suggests. Maritime tracking data confirms that commercial vessel traffic through the Strait of Hormuz continues to face severe, operational disruptions. Simultaneously, domestic inventory metrics in the United States point to a remarkably modest crude build, defying expectations of an impending supply glut.
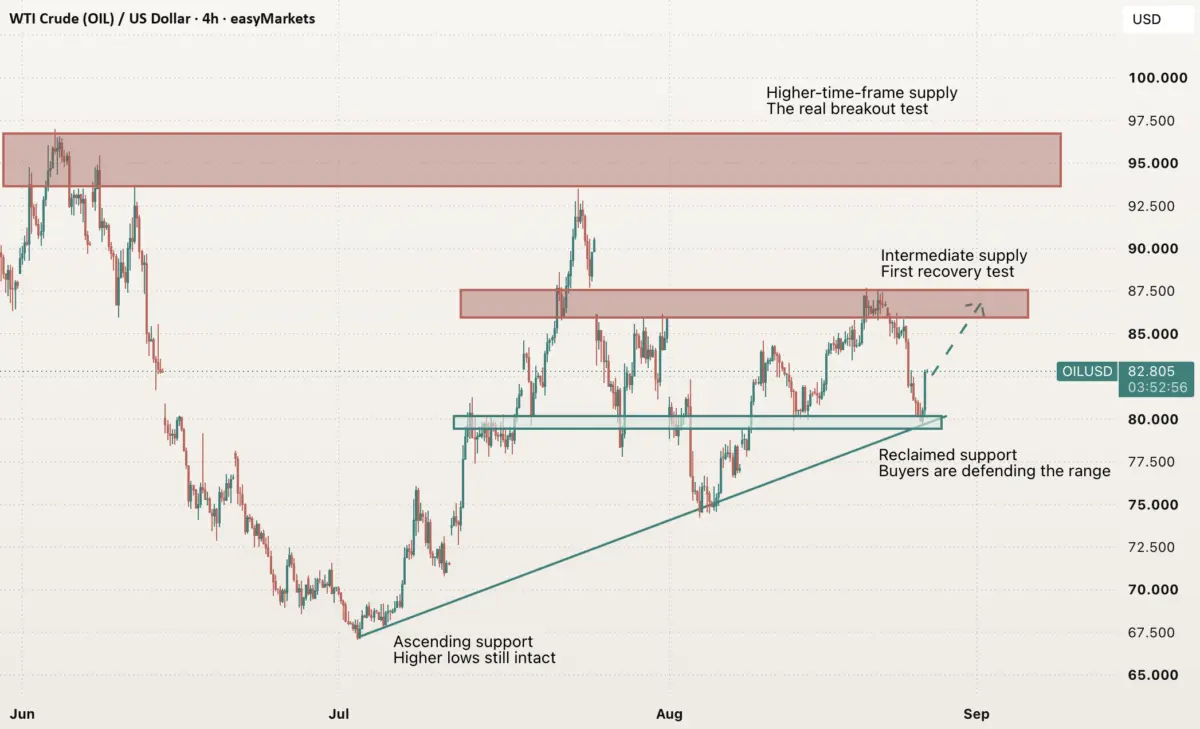
In essence, the modern crude complex is currently pricing the promise of future barrels rather than the stark reality of the barrels physically flowing today. This disconnect between forward-looking market sentiment and immediate physical market tightness has created an environment of heightened volatility. From a technical analysis perspective, the $79.50 to $80.00 region is acting as an interim floor. As long as this crucial demand zone—alongside the broader rising support trendline—remains intact, the medium-term recovery structure cannot be classified as broken.
Nevertheless, the path of least resistance remains hostage to headline-driven news cycles. If diplomatic negotiations yield tangible, structural normalisation of maritime shipping through the Persian Gulf, and the critical $80 support level finally yields, the remaining geopolitical risk premium could unwind at an accelerated pace. Conversely, should physical supply disruptions persist without a corresponding easing of tensions, the underlying tightness of the global balance sheet is likely to reassert itself violently, forcing speculative shorts to cover and driving prices back toward the upper boundaries of their established multi-month trading range.
Detailed Chronology of Recent Price Action and Market Dynamics
To fully comprehend the mechanics behind WTI’s recent descent back to the $80 neighborhood, one must trace the step-by-step evolution of trading sessions over the preceding weeks. The market’s journey began with a concerted upward surge, driven by escalating supply anxieties and persistent geopolitical friction in the Middle East. As risk premiums expanded, WTI steadily climbed out of its early-quarter troughs, methodically testing higher resistance bands.
[WTI Price Trajectory]

   Mid-$80s Resistance Test (Repeated Rejections)
          ▲           ▲           ▲
          │           │           │
     ┌────┴─────┐┌────┴─────┐┌────┴─────┐
     │ Session  ││ Session  ││ Session  │
     └────┬─────┘└────┬─────┘└────┬─────┘
          │           │           │
          ▼           ▼           ▼
   Consolidation ──► Optimism ──► Pullback to $80 Support
The Ascent and the Mid-$80s Rejection
During the initial phase of this recent cycle, speculative capital flowed aggressively into long energy positions. Traders cited deteriorating security conditions along major maritime trade routes, warning of potential supply shocks that could instantly remove millions of barrels per day from the global ledger. This narrative successfully propelled WTI prices upward, pushing the benchmark into the mid-$80s—a technical region that has historically acted as a formidable ceiling for the commodity.
However, each time WTI approached the $85 to $87.50 zone, momentum noticeably stalled. Profit-taking by institutional funds and systematic algorithmic selling routinely intercepted the advances. Market participants who had accumulated long positions lower down the curve opted to lock in gains, wary of holding outsized risk over weekend sessions given the fluid and unpredictable nature of geopolitical headlines. This repeated inability to establish a firm foothold above the mid-$80s signaled to bearish traders that underlying buying pressure was beginning to exhaust itself.
The Catalyst: Shifting Diplomatic Winds
The definitive turning point materialized when wire services began reporting tentative diplomatic progress aimed at securing safe passage through the Strait of Hormuz. Although details remained scarce and implementation timelines ambiguous, the mere prospect of de-escalation was enough to trigger an immediate shift in market psychology.
Algorithmic trading desks, programmed to react instantaneously to geopolitical keywords, initiated rapid long-liquidation sequences. The headline-driven selloff accelerated as traders priced in a worst-case scenario for bulls: an orderly resumption of normal tanker flows, which would instantly flood the market with barrels currently bottlenecked in export terminals. The swiftness of the downward correction underscored just how heavily sentiment-driven and fragile the prior upward momentum had been.
Supporting Context & Metrics: The Disconnect Between Paper and Physical Markets
While the headline-driven selloff has its roots in rational risk-management behavior, a rigorous examination of underlying market metrics reveals a profound friction point. There is a glaring contradiction between the aggressive downward price action observed on futures exchanges and the stubborn tightness characterizing the global physical crude market.
The Strait of Hormuz Reality Check
Financial markets have priced in a swift resolution to maritime transit bottlenecks, yet operational data from maritime intelligence agencies paints a vastly different picture. Tanker tracking and satellite data indicate that commercial shipping through the Strait of Hormuz—which handles roughly one-fifth of the world’s petroleum consumption—remains heavily disrupted. Insurance premiums for vessels traversing the Persian Gulf remain elevated, routing delays persist, and numerous shipping operators continue to exercise extreme caution, opting for longer, more costly detours or pausing voyages altogether.
+-------------------------------------------------------------------------+
|                  THE OIL MARKET DISCONNECT: AT A GLANCE                 |
+-----------------------------------+-------------------------------------+
| PAPER / FUTURES MARKETS           | PHYSICAL / FUNDAMENTAL MARKETS      |
+-----------------------------------+-------------------------------------+
| • Pricing in immediate de-        | • Strait of Hormuz traffic remains  |
|   escalation and normalized trade.|   heavily disrupted and delayed.    |
| • Assuming swift unwinding of     | • Insurance and operational costs   |
|   geopolitical risk premium.      |   for tankers stay elevated.        |
| • Reflects "promise of more       | • U.S. crude inventories show only  |
|   supply" rather than reality.    |   a surprisingly modest build.      |
+-----------------------------------+-------------------------------------+
Consequently, the physical barrels that financial markets assume are freely returning to international markets are, in practice, still facing severe logistical bottlenecks. The gap between what traders expect to happen and what is physically occurring on the water is wider than it has been in quarters.
U.S. Inventory Metrics: Defying Expectations of a Glut
Adding weight to the argument that the physical market remains fundamentally constrained is the latest inventory data released by the U.S. Energy Information Administration (EIA) and the American Petroleum Institute (API). Market consensus had anticipated a substantial crude build, driven by seasonal refinery maintenance and fluctuating domestic production rates.
Instead, the reported inventory build was notably modest—falling well short of analyst expectations. This subdued accumulation suggests that domestic demand remains remarkably resilient, and export demand for U.S. grades (such as WTI Midland) continues to absorb surplus volumes that might otherwise have bloated domestic storage hubs like Cushing, Oklahoma. Far from pointing toward an oversupplied market, the inventory numbers underscore a tightly balanced system where any unexpected supply disruption can rapidly drain available reserves.
Official Statements and Industry Insights
Market analysts, trade associations, and geopolitical strategists have weighed heavily on the current dichotomy between macroeconomic sentiment and microeconomic realities.
Speaking at an energy symposium in Houston, senior commodities strategist Marcus Vance noted the psychological fragility of the current trading range:
"What we are witnessing right now is a textbook case of a market trading the headline rather than the barrel. Financial participants are desperately trying to price in a best-case diplomatic scenario in the Middle East. But if you talk to maritime operators, shipbrokers, and physical traders, the reality on the water is vastly different. The risk premium is being stripped away on a promise, leaving very little margin for error if actual supply delivery falls short."
Concurrently, shipping association representatives have issued cautious statements regarding the status of Persian Gulf transit lanes. While acknowledging that back-channel diplomatic talks are ongoing, commercial risk officers emphasize that operational normalcy cannot be restored overnight.
"Even if a formal agreement were signed tomorrow," stated a leading maritime risk consultancy in a recent advisory note, "the logistics of clearing backlogs, reassuring marine underwriters, and re-routing commercial tankers will take weeks, if not months. The market is vastly underestimating the friction inherent in global maritime supply chains."
Meanwhile, representatives from major producer blocs have maintained a guarded posture. In recent statements, officials from key exporting nations reiterated their commitment to maintaining market stability, while simultaneously acknowledging that their ability to offset unforeseen regional supply shocks is increasingly constrained by shrinking spare capacity margins globally.
Technical Analysis: Key Price Levels and Structural Integrity
Navigating the current crude oil landscape requires a disciplined approach to technical chart analysis. Despite the sharp rejection from the mid-$80s resistance zone, the broader structural architecture of the WTI chart has not yet sustained critical structural damage.
[WTI Technical Price Structure]

     $87.50 ───┬─────────────────────────────────────────── [Upper Resistance Test]
               │            (First Real Test Above)
     $86.00 ───┴───────────────────────────────────────────
               │
               │
               │
               │                  (Recent Pullback / Selloff)
               │
     $80.00 ───┼───────────────────*─────────────────────── [Critical Support Zone]
     $79.50 ───┘                   ▲
                                   │
                                   └─────────────── [Rising Support Trendline]
The Crucial $79.50–$80.00 Support Zone
The absolute epicenter of the current technical debate is the $79.50–$80.00 price band. This zone represents a confluence of historical horizontal support, psychological round-number interest, and the lower boundary of the rising support trendline that has anchored the recovery structure over recent months.
As long as WTI prices successfully defend this area on closing bases, the medium-term bullish recovery structure remains technically valid. A defense of this level suggests that buyers are still willing to step in on dips, viewing the recent selloff as an overreaction to premature diplomatic optimism.
Resistance and Upside Hurdles
On the topside, bulls face an immediate and formidable barrier. The first real test for any renewed recovery rally lies in the $86.00 to $87.50 range. This zone has repeatedly rebuffed buying attempts, serving as the ceiling of the broader multi-month trading range.
- Scenario A (Range Bound): If WTI manages to bounce off the $80 support but encounters aggressive selling upon re-testing the $86–$87.50 band, the market will remain securely locked within its established sideways range. In this environment, range-trading strategies and tactical short-term positioning will dominate institutional order flows.
- Scenario B (Structural Breakdown): Conversely, if diplomatic developments translate into genuine, verifiable normalisation of shipping lanes through the Strait of Hormuz—and the critical $80 support floor decisively fails—the consequences for the technical picture will be severe. A break below $79.50 on high volume would likely trigger an acceleration of sell-stops, allowing the geopolitical risk premium to unwind at a much faster pace and exposing lower technical supports toward the mid-$70s.
Future Outlook and Strategic Implications
As the global energy market looks toward the coming weeks and months, the overarching trajectory of WTI crude will be dictated by the resolution—or escalation—of the tension between paper market sentiment and physical market fundamentals.
The Macroeconomic Crosswinds
Macroeconomic headwinds continue to complicate the demand picture. Persistent inflationary pressures, mixed signals from central banks regarding interest rate trajectories, and uneven economic growth across major industrial economies mean that oil demand cannot be taken for granted. If global manufacturing activity softens further, the physical justification for higher oil prices will weaken, making it even harder for bulls to defend elevated price levels against mounting headwinds.
Strategic Takeaways for Market Participants
For traders, hedgers, and corporate risk managers operating within the energy complex, the current environment demands heightened vigilance and disciplined risk management:
- Monitor Physical Indicators Over Headlines: While breaking news regarding Middle Eastern diplomacy will continue to trigger knee-jerk algorithmic volatility, market participants must anchor their analytical frameworks in hard physical data—specifically tanker tracking metrics, export volumes, and weekly petroleum status reports.
- Respect Technical Boundaries: The integrity of the $79.50–$80.00 support zone is the definitive line in the sand for the current recovery structure. A sustained break beneath this level invalidates the bullish thesis and opens the door for accelerated downside momentum.
- Anticipate Asymmetric Volatility: Because the market is currently pricing the promise of future supply rather than the immediate delivery of physical barrels, any unexpected disruption to maritime traffic or a stall in diplomatic talks could spark a violent, rapid short-squeeze back toward the mid-$80s resistance ceiling.
Ultimately, crude oil is navigating a high-stakes tightrope walk. Until the physical barrels on the water match the optimistic narratives traded on the screens, WTI will remain highly reactive, caught in an intense tug-of-war between geopolitical hope and fundamental reality.
Disclaimer: The information, analysis, and publications provided herein are for informational and educational purposes only and do not constitute financial, investment, trading, or other types of advice or recommendations supplied, endorsed, or validated by TradingView or the publisher. Readers should conduct their own thorough due diligence and consult with a licensed financial professional before executing any trading or investment strategies.