Executive Overview
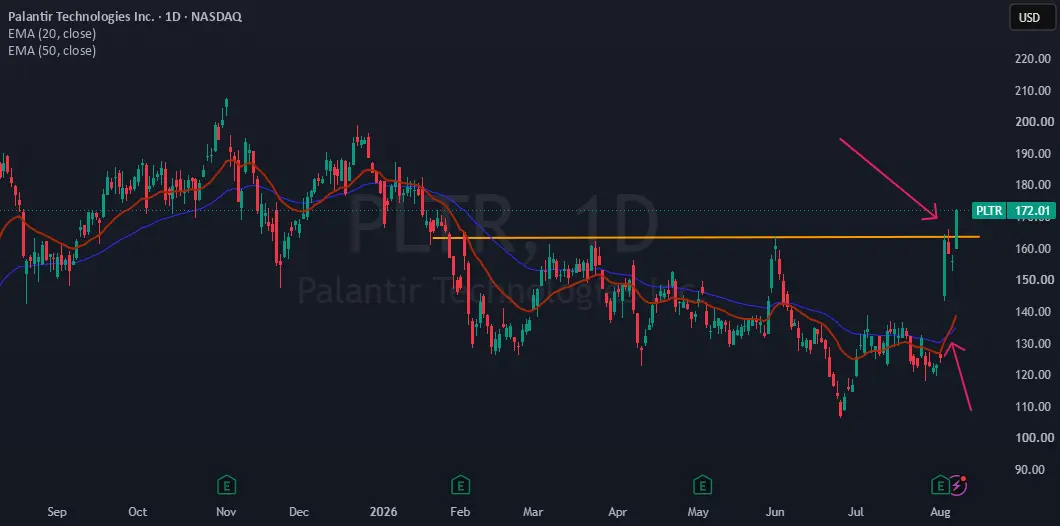
The successful breach of this major resistance zone signals far more than just a short-term price movement; it serves as a robust technical confirmation of a broader trend reversal, effectively signaling the resumption of Palantir’s primary secular uptrend. Accompanying this price action is a dramatic surge in buying momentum, underscored by a classic bullish crossover of the 20-day and 50-day exponential moving averages. With shares now comfortably trading above both key indicators, the technical landscape for Palantir has transformed from cautious stabilization to aggressive bullish expansion.
Beyond the technical charts, Palantir’s breakout is underpinned by staggering fundamental strength. Boasting a colossal $413 billion market capitalization, the data-mining and artificial intelligence titan has firmly established itself as a cornerstone of modern enterprise and defense infrastructure. Operating at the intersection of big data analytics and sovereign security, Palantir’s platforms—Gotham, Foundry, and Apollo—serve as the central operating systems for some of the world’s most critical institutions.
This financial report provides an exhaustive examination of Palantir’s recent market breakout. We will dissect the technical indicators driving the current rally, review the company’s structural business segments, analyze its pristine balance sheet and world-class profitability metrics, evaluate consensus analyst projections, and look ahead at what the next three quarters hold for this high-flying technology bellwether.
Detailed Chronology: The Road to the $163 Breakout
To understand the significance of Palantir’s recent breakthrough, one must retrace the volatile journey the stock has traversed over the past year. The narrative of PLTR throughout 2025 and into early 2026 has been defined by a tug-of-war between aggressive growth expectations and macro-driven multiple compression.
The Q4 2025 Correction and the Forging of Resistance
Following an explosive multi-year run fueled by the global generative artificial intelligence boom, Palantir entered a natural cooling-off period in late 2025. As broader market indices grappled with fluctuating interest rate expectations and shifting sector rotations, PLTR experienced a controlled yet painful downtrend. Investors who had bought near the prior highs found themselves testing their conviction as the stock pulled back from its previous peaks.
By February 2026, a distinct market floor had formed, but upside attempts were consistently rebuffed. The $163 price point quickly evolved into a formidable wall of resistance. Every time the stock approached this level, algorithmic profit-taking and institutional short-term hedging stepped in, beating the price back down and trapping the stock in a tight trading range. This persistent overhead supply created a psychological barrier for retail and institutional participants alike.
The Spring Coiling Phase
Throughout late winter and early spring, the $163 zone acted like a spring being wound tighter and tighter. Trading volume during this consolidation phase dried up relative to the high-turnover days of the prior bull run, a classic hallmark of institutional accumulation. Smart money was quietly absorbing shares from impatient retail sellers, building massive positions just beneath the surface of the resistance line.
The Catalyst and the Break
The dam finally broke in mid-session trading as an influx of institutional buy orders converged on the order books. Catalyzed by growing optimism surrounding upcoming quarterly earnings releases and expanding enterprise contracts, PLTR sliced through the $163 barrier on surging volume.
The breakout was swift and decisive. Short sellers caught on the wrong side of the technical barrier were forced to cover their positions, adding further fuel to the upward surge. By decisively closing above the $163 mark, Palantir invalidated the multi-month bearish channel and cleared the runway for a potential march toward unchartered territory.
Technical Architecture: Momentum and Moving Averages Align
While fundamental investors focus on balance sheets and earnings per share, quantitative and technical analysts monitor the footprints left by market participants on price charts. In Palantir’s case, the technical alignment currently flashing across daily and weekly timeframes is among the strongest seen in the mega-cap technology sector this year.
The Moving Average Crossover
A critical component of the current breakout is the behavior of the company’s moving averages. Over the past several weeks, the short-term 20-day moving average (DMA) has crossed upward through the 50-day moving average (DMA). This golden-cross variant on intermediate timeframes is a reliable indicator that short-term momentum has decisively overtaken medium-term trends.
Furthermore, Palantir is now trading comfortably above both the 20-day and 50-day moving averages. These lines, which previously acted as overhead resistance during the early phases of the recovery, have now flipped into dynamic support levels. Should the stock experience a minor intraday pullback or consolidation phase, these moving averages are expected to act as a safety net, absorbing selling pressure and providing a springboard for the next leg higher.
Volume Profile and Institutional Accumulation
Volume analysis confirms the validity of the breakout. Unlike false breakouts characterized by low volume and weak participation, Palantir’s push past $163 was accompanied by a dramatic expansion in daily trading volume. This indicates that institutional sponsorship—mutual funds, pension funds, and large-scale hedge funds—is actively driving the move, rather than speculative retail day traders.
With the overhead resistance turned into support, the path of least resistance for Palantir’s stock price has decisively shifted upward, opening the technical door for a sustained rally.
Fundamental Strength: Inside Palantir’s Business Segments and Financial Fortitude
While charts and technical indicators provide the timing for trades, underlying fundamentals justify long-term investment. Palantir Technologies, commanding a staggering $413 billion market capitalization, is no longer a speculative startup; it is a foundational pillar of the global technology infrastructure.
Dual-Engine Growth: Commercial and Government Segments
Palantir’s market dominance stems from its ability to deploy software platforms that act as central operating systems for complex organizations. The company operates through two distinct yet synergistic business pillars:
- The Government Segment: Historically the bedrock of Palantir’s business, this division provides cutting-edge software services to U.S. and international defense, intelligence, and national security agencies. Platforms like Palantir Gotham allow military commanders and intelligence analysts to integrate disparate data streams, track targets, and make split-second operational decisions in high-stakes environments. The stickiness of these government contracts ensures high-margin, recurring revenue streams that are largely insulated from broader macroeconomic downturns.
- The Commercial Segment: Representing the company’s primary growth engine over recent quarters, the Commercial segment serves enterprises across non-government industries, including healthcare, energy, automotive, and financial services. Utilizing platforms like Palantir Foundry and the groundbreaking Artificial Intelligence Platform (AIP), commercial customers are able to harness their proprietary data to run simulations, optimize supply chains, and integrate generative AI models securely into their core workflows.
Narrow Economic Moat and Elite Profitability
From a valuation and operational perspective, Palantir occupies a rare echelon in corporate history. Evaluated as a "narrow economic moat" company due to the deeply entrenched nature of its software within client operations, Palantir has delivered jaw-dropping financial metrics over the last three consecutive quarters.
- Operating Margin: An exceptional 47%, demonstrating immense pricing power and strict operational efficiency.
- Net Margin: An astonishing 55%, highlighting the software-as-a-service (SaaS) scalability where every additional dollar of revenue flows overwhelmingly to the bottom line.
- Return on Equity (ROE): A powerful 38%, proving management’s elite ability to generate profits from shareholder capital.
- Return on Invested Capital (ROIC): A stellar 37%, emphasizing that capital allocation decisions are yielding extraordinary economic returns.
A Fortress Balance Sheet
In an economic environment where debt servicing costs can crush vulnerable corporations, Palantir stands out as a fortress of financial health. The company boasts a current ratio of 7.2x, meaning its short-term assets dwarf its short-term liabilities by more than seven times.
Even more impressive is its debt-to-equity ratio of just 0.02x. By operating with virtually zero debt, Palantir is entirely self-funding and possesses the financial flexibility to weather any macro storm, pursue aggressive research and development, or execute strategic mergers and acquisitions without diluting shareholders or facing credit downgrades.
Future Outlook: Analyst Projections and Growth Catalysts
As Palantir digests its historic breakout above $163, market participants are turning their gaze toward the horizon. The fundamental roadmap for the next several quarters indicates that the current stock price appreciation is backed by accelerating operational performance.
Earnings Growth Projections
Consensus estimates project that Palantir’s Earnings Per Share (EPS) will continue its aggressive upward trajectory over the next three quarters. This forecasted expansion in profitability is expected to provide fundamental validation for the stock’s elevated valuation multiples. Unlike many high-growth technology companies that trade purely on future promises, Palantir’s earnings growth is backed by actual, high-margin cash generation.
Wall Street Consensus and Price Targets
The Wall Street analyst community has been forced to continuously revise their models upward to keep pace with Palantir’s relentless execution. The current average analyst price target stands at $197.71.
Compared to its breakout levels, this consensus target implies substantial further upside potential. Should the company continue to beat earnings expectations, sign high-value commercial contracts, and expand its footprint in international defense markets, analysts may well push their price targets even higher, triggering a new wave of institutional upgrades.
Key Risks to Monitor
While the outlook is overwhelmingly bullish, prudent investors must remain vigilant regarding potential risk factors:
- Valuation Multiple Compression: Given its $413 billion market cap and lofty price-to-earnings ratios, any macroeconomic shock or minor earnings miss could trigger sharp, albeit potentially temporary, corrections.
- Geopolitical and Regulatory Headwinds: As a primary contractor for defense and intelligence agencies, Palantir is exposed to shifts in government defense budgets, political transitions, and complex international compliance regulations.
- Execution Risk in Commercial Scaling: Maintaining hyper-growth in the commercial sector requires continuous innovation and outperforming agile competitors in the generative AI space.
Conclusion
Palantir Technologies has crossed a major psychological and technical Rubicon by shattering the $163 resistance zone. Backed by a powerful bullish moving average crossover, expanding institutional volume, elite financial metrics—including a 47% operating margin and a near-debt-free balance sheet—and a massive $413 billion market valuation, PLTR has proven that its growth story is far from over.
With consensus analyst price targets pointing toward $197.71 and earnings estimates climbing for the upcoming quarters, the stage is set for Palantir to cement its status as one of the defining technology powerhouses of the 21st century.
Disclaimer: The information and publications contained herein are for informational and educational purposes only and are not meant to be, and do not constitute, financial, investment, trading, or other types of advice or recommendations supplied or endorsed by TradingView or the publisher. Always conduct thorough due diligence before making any investment decisions.