Executive Overview
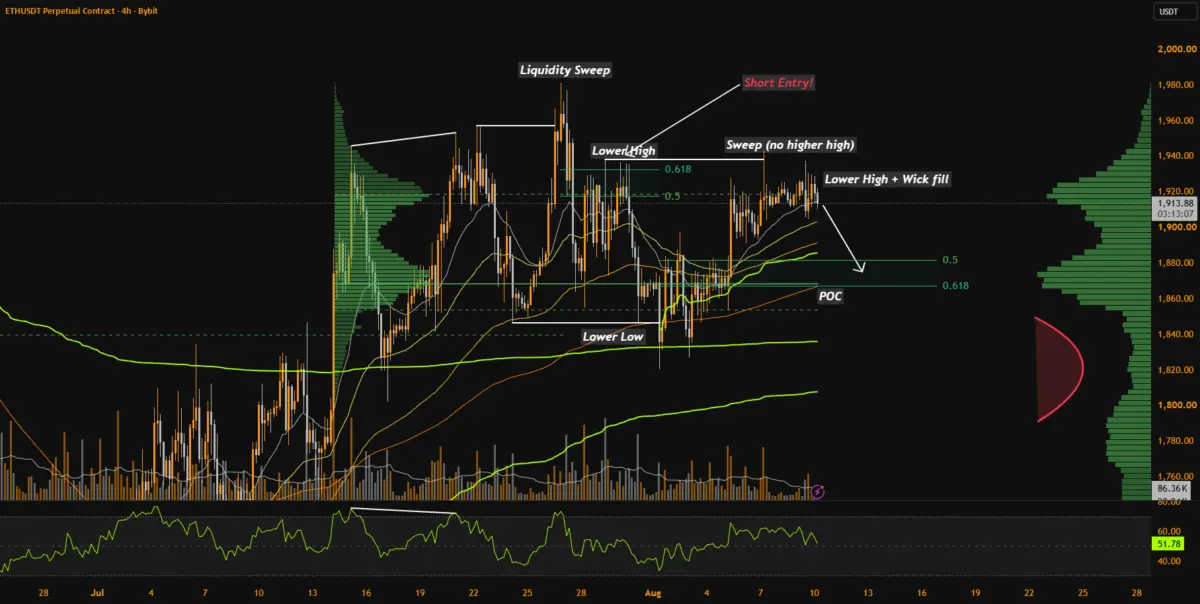
This report provides an in-depth examination of an ongoing, structural short position on Ethereum, as articulated by market participant and technical analyst Maxi Onti. Rather than reacting impulsively to short-term intraday noise, high-frequency wicks, or emotional market swings, this trading strategy is anchored strictly in macro-level technical indicators and a well-defined 4-hour (4H) timeframe market structure.
The core thesis governing this short position is uncomplicated yet rigorous: as long as Ethereum continues to print a sequence of lower highs (LH) and lower lows (LL)—failing to reclaim critical Fibonacci confluence zones and key structural resistance levels—the overarching market bias remains firmly bearish. This analysis will dissect the mechanics of this trade, explore the underlying price action principles, evaluate the metrics and tools used to define invalidation points, and contextualize what this means for institutional and retail market participants alike.
Detailed Chronology: Anatomy of the 4-Hour Bearish Trend
To understand why experienced traders are willing to let short positions run through periods of consolidation, one must examine the chronological development of Ethereum’s recent price action on the 4-hour timeframe.
The Shift in Momentum
The genesis of the current bearish bias began when Ethereum failed to sustain its upward momentum near previous macro resistance levels. Following a rejection from higher valuation zones, ETH attempted a recovery bounce that ultimately lacked the necessary volume and buyer participation to flip the macro trend.
As buying pressure waned, sellers stepped in to establish a definitive lower high. This rejection established the ceiling for the current market phase. Shortly after, ETH broke down through intermediate local supports, confirming the formation of a lower low and initiating the classic structural blueprint of a downtrend: a continuous staircase of descending peaks and troughs.
Ignoring the "Noise"
During the execution phase of this trade, Ethereum’s price action has inevitably experienced localized counter-trend bounces and short-term relief rallies. For inexperienced traders, these sudden green candles—often amplified by leverage liquidations or order-book imbalances—can induce panic, prompting premature exits or accidental stop-loss triggers.
However, professional risk management dictates a macro-first approach. By focusing exclusively on the 4-hour timeframe structure rather than getting hypnotized by 1-minute or 5-minute charts, the trader behind this strategy has opted to ignore short-term market noise. Single price wicks that temporarily breach local resistance without sustained volume or structural closure are treated as market anomalies rather than trend reversals. The position remains active because the structural pillars of the downtrend have yet to be compromised.
Supporting Context & Metrics: Technical Indicators and Fibonacci Confluence
Executing a short position in a major crypto asset requires more than a pessimistic outlook; it demands objective, mathematically driven validation. In this scenario, the trader relies on classic technical analysis frameworks, specifically focusing on market structure sequencing, Fibonacci retracement levels, and structural resistance zones.
[4H Resistance / Key Lower High] <--- Crucial Invalidation Zone (Requires Close & Acceptance)
         |
         v  <--- Active Short Position Maintained
[Interim Consolidation / Noise]
         |
         v
[Lower Low / Ongoing Downtrend]
The Power of Lower Highs and Lower Lows
In technical analysis, a downtrend is defined by an unbroken sequence of lower highs and lower lows.
- Lower Highs (LH): Each successive recovery attempt peaks at a lower price point than the previous one, signaling that sellers are aggressively defending lower valuations and that buyers are exhausted at earlier stages.
- Lower Lows (LL): Each subsequent sell-off breaches previous support levels, demonstrating that downside demand is deep and buyers are unwilling to step in to defend previous floors.
As long as Ethereum continues to respect this geometric progression on the 4-hour chart, the probability matrix heavily favors the downside. Trend-following strategies historically yield their highest risk-adjusted returns when traders align themselves with the prevailing momentum rather than attempting to catch falling knives or prematurely fade strong trends.

Fibonacci Confluence Zones and Key Resistances
To objectively define where the trade thesis would fail, technical analysts utilize Fibonacci retracement tools combined with historical volume profile nodes and horizontal support/resistance flips.
In the case of the active ETH short, the crucial invalidation threshold is not determined by an arbitrary dollar amount or emotional tipping point. Instead, it rests within a specific Fibonacci confluence zone coupled with a key structural lower high.
- The Invalidation Criteria: For the bearish thesis to be officially invalidated, the market must do more than just flash a temporary price wick above resistance. It requires a clear, confirmed break, followed by a sustained hold and market acceptance above the relevant lower-high structure.
- Market Acceptance: In trading parlance, "acceptance" means that price candles close consistently above the resistance level, turning former supply zones into new demand floors. Without this definitive structural shift, any upward push is categorized as a routine corrective bounce within an active bear cycle.
Official Statements and Trader Perspective
Navigating high-stakes digital asset markets requires psychological resilience and absolute transparency regarding risk exposure. The sentiment driving this trade is rooted in disciplined risk management and an analytical detachment from emotional outcomes.
"My ETH short is still active and I’m letting it run… Until price starts printing and holding higher highs while reclaiming the key lower-high + Fib confluence zone, the structure remains bearish on the 4h TF."
This perspective highlights a fundamental truth of professional trading: process matters more than individual trade outcomes. By establishing clear rules of engagement—where the trade is entered, how it is managed, and precisely where it is invalidated—the trader removes ambiguity from the equation.
Furthermore, the emphasis on structural integrity over short-term volatility underscores an awareness of market psychology. Retail traders frequently suffer from "emotional damage" by over-leveraging and reacting to every minor price fluctuation. By stepping back, monitoring higher timeframe charts, and sharing raw market observations without offering formal financial advice ("NFA"), analysts foster a healthier, more analytical trading community.
Future Outlook: What Lies Ahead for Ethereum?
As we look toward the medium-term horizon, the trajectory of Ethereum’s price action hinges entirely on how market participants react to upcoming macro catalysts and structural test zones.
Bearish Continuation Scenario
If Ethereum continues to respect the current 4-hour bearish channel, sellers are likely to target deeper liquidity pools below current local lows. A failure to reclaim the key Fibonacci resistance zone will reinforce the dominant downward trend, potentially inviting additional institutional short volume and driving prices toward major historical support levels. For the active short position, this scenario validates the decision to let the trade run, maximizing profit potential through disciplined trend-following.
Bullish Reversal Scenario
Conversely, market dynamics can shift rapidly in the digital asset space. For the bearish thesis to be dismantled, buyers must engineer a powerful volume-backed breakout. This would require:
- A decisive daily or 4H candle close above the critical lower-high resistance structure.
- Successful retesting and holding of that former resistance as new support.
- A shift in the market structure from lower highs and lower lows to higher highs and higher lows.
Until such a structural shift is definitively printed on the charts, any aggressive long positioning carries substantial counter-trend risk.
Conclusion
In summary, the ongoing Ethereum short position is a textbook example of structured, trend-following risk management. By ignoring intraday noise, anchoring decisions to the 4-hour timeframe, and strictly defining invalidation parameters through Fibonacci confluence and market structure, traders can navigate turbulent market conditions with clarity and precision. Whether the trend ultimately breaks to the upside or continues its downward descent, disciplined adherence to technical reality remains the ultimate edge in crypto trading.