Executive Overview
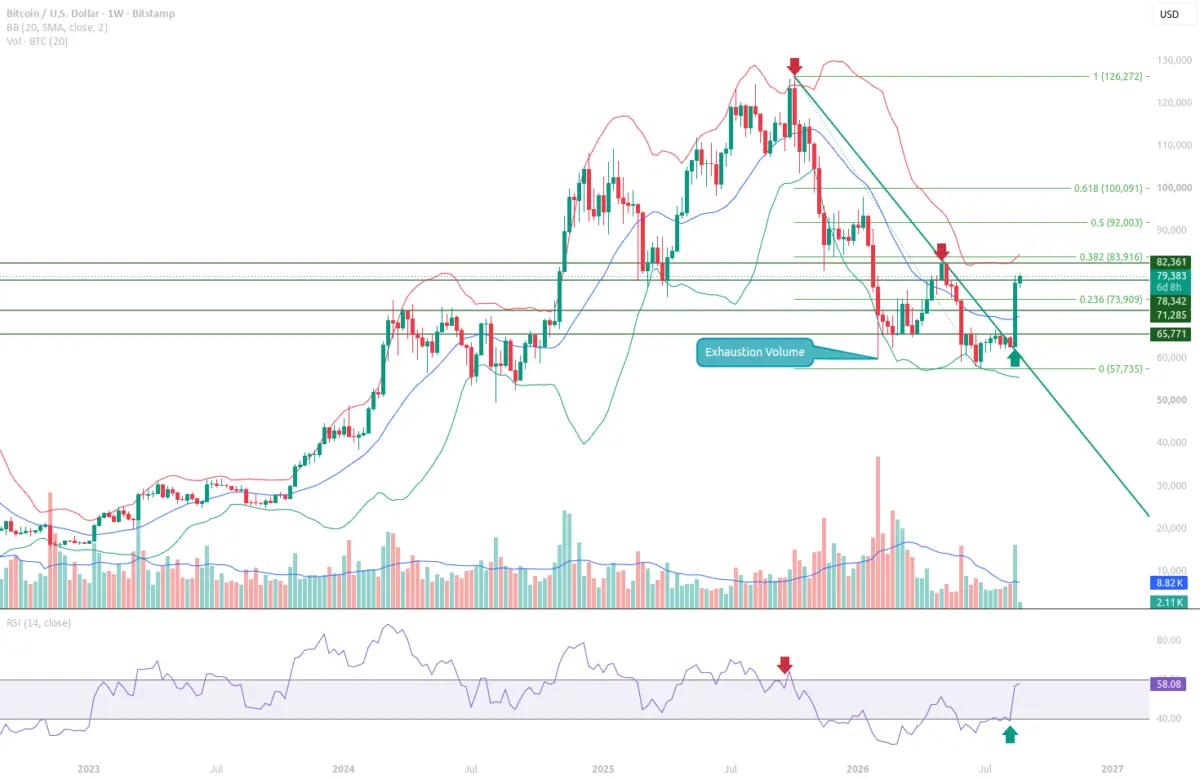
While the broader macroeconomic structure remains bound within a larger downtrend, the formation of a robust multi-week base near recent cycle lows has yielded a pronounced technical reaction. Price action has firmly reclaimed ground above both this downward-sloping boundary and the Mid Bollinger Band, signaling a significant behavioral shift among market participants. Momentum oscillators corroborate this development, with the Relative Strength Index (RSI) steadily recovering from foundational support near the 40 threshold and now approaching the psychologically and technically vital 60 level.
Despite these encouraging developments, institutional analysts and seasoned traders urge caution. The current price action is transpiring within a high-stakes congestion zone spanning from $73,909 to $83,916. This corridor represents the ultimate battleground between market bulls attempting to establish a durable accumulation launchpad and bears waiting to fade the rally and resume the prevailing macro downtrend. As volume exhaustion patterns suggest that aggressive selling pressure may have finally found absorption, the coming weeks will determine whether this movement is merely a sophisticated bear-market bounce or the nascent stages of a structural trend reversal.
Detailed Chronology
To understand the weight of Bitcoin’s recent weekly close at $77,716, it is essential to contextualize the historical trajectory that forged current market conditions throughout 2026.
The Descent and Base Formation
The preceding months were characterized by an unrelenting downward trajectory. Every minor relief rally was systematically met with aggressive distribution, trapping late-stage retail longs and forcing leveraged market participants out of their positions. This downward momentum was strictly governed by a steep descending trendline that acted as an impenetrable ceiling. Each test of this dynamic resistance resulted in swift rejections, driving prices lower and testing the psychological fortitude of long-term holders.
However, as Bitcoin approached local cycle lows, market behavior began to subtly alter. The cadence of selling decelerated noticeably, accompanied by declining volume signatures that pointed toward exhaustion among active sellers. This phenomenon—whereby relentless downward pressure is systematically absorbed by passive limit buyers—laid the groundwork for a structural base formation. Rather than cascading into a severe capitulation event, the asset carved out a durable local floor, laying the foundation for the subsequent relief rally.
Breaking the Trendline
The inflection point materialized over the weekly candle closing on August 23, 2026. For the first time since the inception of the current correction phase, Bitcoin managed not only to test the descending trendline but to post a confirmed weekly close above it. Concurrently, price action surged past the Mid Bollinger Band, shifting the immediate-term bias from bearish continuation to neutral-to-bullish consolidation.
This decisive break invalidated the strict geometric constraints that had dictated the market’s downward spiral for months. As liquidity cleared above the trendline, short-term momentum traders stepped in, fueling a push toward the current trading handle of $77,716 and setting the stage for a test of immediate overhead resistance zones.
Supporting Context & Metrics
A rigorous evaluation of Bitcoin’s technical posture requires a granular examination of underlying market indicators, momentum oscillators, and structural volume profiles.
+-------------------------------------------------------------------------+
|                        CURRENT MARKET METRICS                           |
+------------------------------+------------------------------------------+
| Metric                       | Value / Level                            |
+------------------------------+------------------------------------------+
| Close Price (Week of Aug 23) | $77,716                                  |
| RSI (14-period)              | 56.61 (Recovering from 40 support)       |
| Mid Bollinger Band           | $69,497 (Acting as immediate support)    |
| Immediate Resistance         | $78,342                                  |
| Key Resistance               | $82,361                                  |
| Major Resistance (Fib 0.382) | $83,916                                  |
| Immediate Support (Fib 0.236)| $73,909                                  |
| Key Support                  | $71,285                                  |
+------------------------------+------------------------------------------+
Momentum Indicators: RSI and Bollinger Bands
Momentum analysis provides vital clues regarding the sustainability of Bitcoin’s recent advance. The 14-period Relative Strength Index (RSI) currently sits at 56.61. Crucially, this metric has staged a textbook recovery from the 40 support zone, a region that historically separates weak corrections from deep structural bear markets.
While an RSI reading in the mid-50s confirms building buying momentum, technical analysts emphasize that a sustained weekly close above the crucial RSI 60 threshold is required to validate this movement as a genuine macro trend shift rather than a standard counter-trend bounce. Crossing and holding above 60 would indicate that buyers are successfully seizing control of the intermediate momentum cycle.
Complementing the RSI reading, the Bollinger Bands illustrate a broadening of volatility following a period of compression near the lows. Price is currently positioned safely above the Mid Bollinger Band, which stands at $69,497. In standard technical analysis, the Mid Band (typically a 20-period Simple Moving Average) transitions from a dynamic resistance level during downtrends into a reliable dynamic support level during recoveries. As long as Bitcoin trades above $69,497, the path of least resistance remains tilted toward the upside.
Volume Dynamics and Exhaustion Signatures
Volume profile analysis offers additional depth to the current base-building thesis. During the final legs of the prior decline, on-chain and exchange volume metrics displayed textbook exhaustion characteristics. High-volume sell-offs failed to push prices to new relative lows—a classic divergence signaling that aggressive sell-side liquidity was being absorbed by deep-pocketed buyers and institutional accumulation entities.
This volume profile supports the legitimacy of the recent trendline breakout. Spikes in buying volume accompanying the break above the descending resistance line confirm that market participants are willing to commit capital at higher valuations, reducing the probability of an immediate, sharp retracement back into the previous price channel.
Mapping the Battlefield: Resistance and Support Levels
To navigate the upcoming market sessions, traders and risk managers are closely monitoring a clearly defined matrix of technical boundaries:
- Immediate Resistance ($78,342): The first localized ceiling encountered by price action following the weekly close. A decisive breakout above this level opens the door for a rapid test of higher psychological barriers.
- Key Resistance ($82,361): An intermediate structural barrier representing previous consolidation highs and cluster liquidity zones from earlier phases of the market cycle.
- Major Resistance ($83,916 – Fibonacci 0.382): The primary macro inflection point. A successful reclaim of the 0.382 Fibonacci retracement level would invalidate a significant portion of the preceding downtrend and signal a potential regime change.
- Immediate Support ($73,909 – Fibonacci 0.236): The first line of defense for the bulls. Holding this level during any near-term retests is vital for maintaining the integrity of the base formation.
- Key Support ($71,285): A secondary structural cushion backed by historical volume nodes and cluster buying interest.
- Strong Support ($69,497 – Mid Bollinger Band): The absolute structural floor for the current recovery thesis. A breach below this level would signal a complete failure of the breakout and likely trigger a swift return to the macro downtrend.
Official Statements and Market Perspectives
As financial markets digest Bitcoin’s technical breakout, industry commentators, quantitative researchers, and market strategists have weighed in on the implications of the recent weekly close.
Market structure analysts note that while breaking a descending trendline is a mandatory first step for any cyclical recovery, it should not be confused with a confirmed macro bull market. "Reclaiming the structural trendline removes the immediate geometric headwind that has dictated market behavior for months," notes a prominent digital asset quantitative researcher. "However, the asset is now operating inside a dense liquidity cluster between $73,900 and $83,900. Until we see a confirmed weekly close above the 0.382 Fibonacci retracement level at $83,916, prudence dictates treating this as a high-level consolidation and potential bear-market relief rally."
Institutional trading desks have similarly adopted a balanced stance. While derivatives data indicates a modest uptick in open interest and a normalization of funding rates—suggesting that speculative leverage has been largely purged from the system—spot accumulation remains the primary driver of the current move. This spot-led price action is widely viewed as healthier than leveraged-fueled surges, though it also implies that sustained capital inflows will be required to push through the heavy overhead resistance waiting in the low $80,000s.
Future Outlook
The immediate future of Bitcoin’s price trajectory hinges entirely on how price action resolves within the critical $73,909 to $83,916 range. This zone represents the crucible that will decide whether the asset’s recent technical developments translate into sustained upward momentum or fade into another failed recovery attempt.
Bullish Scenario: The Launchpad Thesis
In an optimal bullish scenario, Bitcoin will leverage the newly conquered descending trendline and the $73,909 immediate support zone as a springboard for further appreciation. Should buyers successfully absorb remaining overhead supply at the $78,342 immediate resistance and push through the $82,361 key resistance, all eyes will turn to the major resistance test at $83,916 (Fibonacci 0.382).
A decisive weekly close above $83,916, accompanied by the RSI solidifying its position above the 60 threshold, would serve as a high-conviction signal that the broader macro downtrend has been broken. Such a development would likely trigger FOMO (Fear of Missing Out) among sidelined retail and institutional investors, opening a clear pathway toward higher Fibonacci extension targets and re-engaging the broader multi-year secular bull market narrative.
Bearish Scenario: Stalling Out and Trend Reversal
Conversely, failure to maintain momentum above the current levels could prove costly for market bulls. If Bitcoin encounters insurmountable selling pressure near the $78,342 or $82,361 barriers, price action risks stalling out and rolling back into the established downtrend channel.
A breakdown below the immediate support at $73,909 would invalidate the base-building thesis, shifting focus back toward the key support at $71,285 and the ultimate safety net provided by the Mid Bollinger Band at $69,497. A decisive weekly close beneath the Mid Band would confirm that the trendline breakout was a false signal (or "bull trap"), likely plunging the asset back into a protracted period of consolidation and capitulation risks near previous cycle lows.
Conclusion
Bitcoin’s weekly close above the descending trendline at $77,716 undeniably marks a welcome shift in near-term market behavior. By breaking out of its geometric constraints, recovering key moving averages, and seeing RSI climb toward 60, the asset has demonstrated undeniable technical resilience. Yet, the broader macro downtrend has not yet been fully erased. As market participants navigate the crucial $73,909–$83,916 range, patience, disciplined risk management, and rigorous monitoring of momentum and volume indicators will remain paramount for all active market participants.
Disclaimer: This analysis is provided for informational and educational purposes only. It does not constitute financial, investment, trading, or legal advice, nor does it represent a recommendation to buy, sell, or hold any digital asset or financial instrument. Cryptocurrency markets are highly volatile and carry substantial risk of loss. All technical analysis is based on historical market data and is subject to change without notice. Users are solely responsible for conducting their own due diligence and making their own investment decisions.