Executive Overview
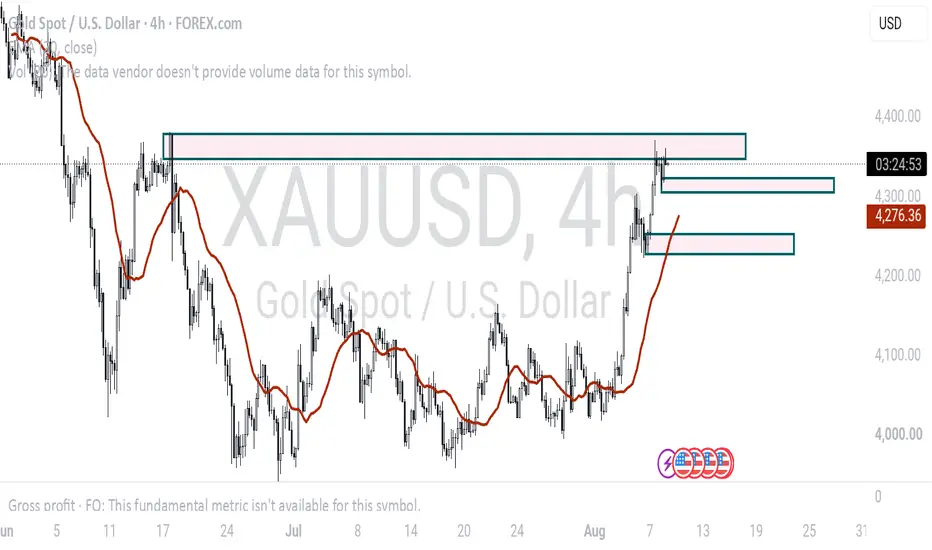
Recent market commentary from prominent technical analysts—such as community insights shared by traders like Ftxmoseseli600 on major charting platforms—highlights a universal preoccupation with critical inflection points. Traders are closely monitoring key support and resistance zones, waiting for definitive market confirmations rather than attempting to catch falling knives or prematurely shorting explosive rallies. The prevailing sentiment leans toward a cautiously optimistic long posture, contingent upon structural breakouts and subsequent retests of established support levels.
This report provides a comprehensive examination of the current technical landscape surrounding XAU/USD. By dissecting market sentiment, historical price action, macroeconomic catalysts, and potential risk factors, we offer an exhaustive investigative overview designed for both retail participants and institutional observers seeking to understand the mechanics driving gold’s current trajectory.
Detailed Chronology
Understanding the present valuation of XAU/USD requires a granular look at the chronological build-up of price action leading into August 2026. The path to the current technical junction has been paved by a series of high-stakes macroeconomic data releases, central bank policy adjustments, and sudden shifts in market liquidity.
Phase One: The Consolidation Trap (Early to Mid-2026)
Following volatile swings in late 2025, gold entered a prolonged period of consolidation. During this phase, XAU/USD oscillated within a tightly defined range. Institutional participants accumulated positions while retail sentiment wavered between exhaustion and aggressive breakout speculation. Price action during these months formed a classic symmetrical triangle on daily and weekly charts, signaling that market compression was reaching a boiling point.
Phase Two: The Catalyst Surge (Late July 2026)
As global central banks signaled divergent paths regarding interest rate trajectories, macroeconomic data began to sway foreign exchange and commodities desks. Weaker-than-expected employment figures from major economies triggered a renewed rush into safe-haven assets. Gold experienced sharp intraday rallies, testing upper resistance boundaries that had previously repelled bullish advances multiple times throughout the year.
Phase Three: The Current Inflection Point (August 2026)
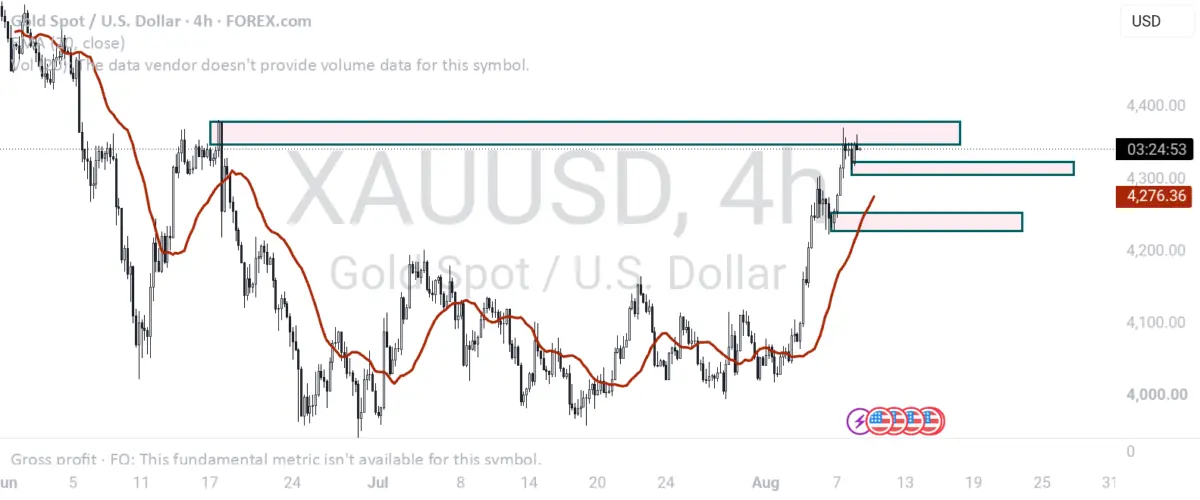
As of August 10, 2026, XAU/USD sits precariously at a historical crossroads. Technical analysts are shifting away from blind momentum chasing toward disciplined strategy formulation. Rather than entering unconfirmed positions, market commentators note a widespread tactical pivot: traders are actively monitoring key supply zones, waiting for a decisive breakout followed by a healthy technical retest. This methodology minimizes slippage and false breakouts, ensuring that any subsequent leg upward—often colloquially termed by traders as flying "to the moon"—is supported by genuine volume and institutional backing.

Supporting Context & Metrics
To fully comprehend the mechanics behind the current XAU/USD setup, one must examine the underlying metrics, correlation indicators, and structural market conditions influencing bullion.
1. The DXY Correlation and Real Yields
The inverse relationship between the U.S. Dollar Index (DXY) and gold remains one of the most reliable barometers for XAU/USD direction. Throughout recent trading sessions, softening treasury yields have exerted downward pressure on the greenback, inadvertently creating a tailwind for non-yielding bullion. When real yields decline, the opportunity cost of holding physical gold or digital gold derivatives decreases, encouraging capital reallocation from fixed-income securities into precious metals.
2. Volume Profile and Open Interest
Derivatives exchanges report a notable spike in open interest across gold futures and spot contracts. This increase in open interest, paired with stable-to-rising price action, indicates that new capital is entering the market rather than existing positions merely changing hands. Furthermore, volume profile indicators show high-volume nodes clustered just below current spot prices, suggesting that these regions will act robustly as structural support should a retracement occur before any major breakout.
3. Sentiment Indicators and Retail Positioning
Retail sentiment indexes—often tracked via crowd-sourced trading platforms—reveal a predominantly long bias among individual market participants. While institutional positioning tends to be more nuanced and hedged via options contracts, the heavy retail leaning introduces the risk of localized shakeouts. Smart money operators frequently target retail stop-loss clusters positioned just beneath key technical moving averages or psychological round numbers before initiating a true directional trend. Therefore, patience and confirmation remain the cornerstones of prudent risk management in the current climate.
Official Statements and Institutional Perspectives
While retail traders debate the immediate viability of breakout strategies on social trading networks, global financial institutions and monetary authorities continue to shape the broader fundamental backdrop for gold.
Central Bank Accumulation Trends
Data from the World Gold Council and international monetary authorities indicates that central bank net purchases of gold remain structurally elevated. Emerging market central banks, in particular, continue to diversify their foreign exchange reserves away from fiat dominance, securing physical gold reserves to hedge against geopolitical fragmentation and currency volatility. This institutional baseline provides a formidable price floor, mitigating the depth of potential market corrections.
Commentary from Market Strategists
Leading commodity strategists from major Wall Street banking institutions have recently updated their year-end outlooks for gold. While short-term volatility is universally acknowledged as a byproduct of shifting macroeconomic data prints, the long-term structural thesis remains bullish.
"The intersection of structural fiscal deficits, persistent geopolitical friction, and the eventual pivot toward global monetary easing creates a goldilocks environment for precious metals," notes a senior commodities strategist at a premier global investment bank. "Technical breakouts observed in spot prices are merely symptomatic of a deeper, macro-driven realignment of global capital."
Institutional commentary consistently emphasizes risk mitigation. Analysts advise market participants to avoid emotional FOMO (Fear Of Missing Out) buying during aggressive vertical pumps. Instead, institutional desks advocate for disciplined limit orders placed at historical value areas or validated breakout retest zones.
Future Outlook: Navigating the Road Ahead
As we peer into the remainder of 2026 and beyond, the trajectory of XAU/USD will likely be dictated by a delicate interplay between technical execution and macroeconomic reality.
Bullish Scenario: The Breakout and Retest
In the favored technical scenario shared by community analysts and veteran traders alike, gold will successfully breach immediate resistance thresholds on expanding volume. Following this breakout, a healthy pullback—or retest—of the former resistance turned support will occur. This technical blueprint allows bulls to establish high-probability long positions with tight, mathematically sound stop-loss parameters. If this setup materializes cleanly, historical resistance zones will transform into launchpads for sustained upward momentum, paving the way for aggressive rallies toward uncharted price territories.
Bearish Scenario: False Breakouts and Range Bound Consolidation
Conversely, market participants must remain cognizant of bearish tail risks. If macroeconomic data prints stronger than anticipated—forcing central banks to adopt a more hawkish stance—the U.S. dollar could experience a sharp resurgence. In this environment, a failed breakout above key resistance would trap aggressive late-longs, triggering a cascading series of long liquidations. Prices could quickly revert back to the mean, locking XAU/USD within a frustrating range-bound consolidation pattern for weeks or even months.
Strategic Recommendations for Traders and Investors
- Patience Over Impulse: Avoid chasing explosive intraday candles without structural confirmation. Wait for the market to complete its natural cycle of breakout, consolidation, and retest.
- Strict Risk Management: Given the inherent volatility of spot metals and leveraged trading products, ensure that position sizing reflects account risk tolerances. Never risk more capital than you can afford to lose.
- Macro Vigilance: Keep a close eye on upcoming macroeconomic announcements, including inflation prints, employment reports, and central bank speeches. Technical analysis provides the map, but fundamental data often dictates the weather.
Disclaimer: The information, analysis, and insights presented in this article are intended for informational and educational purposes only. They do not constitute financial, investment, trading, or legal advice. Trading spot gold (XAU/USD) and other financial instruments carries a high level of risk and may not be suitable for all investors. Always conduct your own due diligence and consult with a licensed financial professional before making any investment decisions.