Executive Overview
A granular technical dissection of XRP’s price action—anchored across a three-day timeframe—reveals the formation of a critical horizontal channel. This technical structure serves as a dual-purpose zone: a potential cradle for long-term volatility compression, and a battleground where the foundational accumulation and capitulation phases of the next multi-year market cycle will be forged.
By mapping out historical price behaviors from the 2022–2025 macro cycle, market analysts can reverse-engineer institutional behavior, identifying the distinct transition points from prolonged market despair to aggressive capital distribution. Understanding these zones is no longer optional for serious market participants; it is a prerequisite for navigating the treacherous waters of digital asset investing. This report delivers an exhaustive, institutional-grade breakdown of XRP’s structural mechanics, evaluating historical performance metrics, macroeconomic trend overlays, and forward-looking volatility projections to provide traders and investors with a comprehensive roadmap for the coming cycle.
Detailed Chronology: Anatomy of the 2022–2025 Market Cycle
To comprehend where XRP is heading, one must meticulously analyze where it has been. The 2022–2025 market cycle offers a masterclass in market psychology, showcasing the distinct phases that define an asset’s transition from deep value territory to overextended public mania.
Phase 1: The Crucible of Capitulation (March 2023 – November 2023)
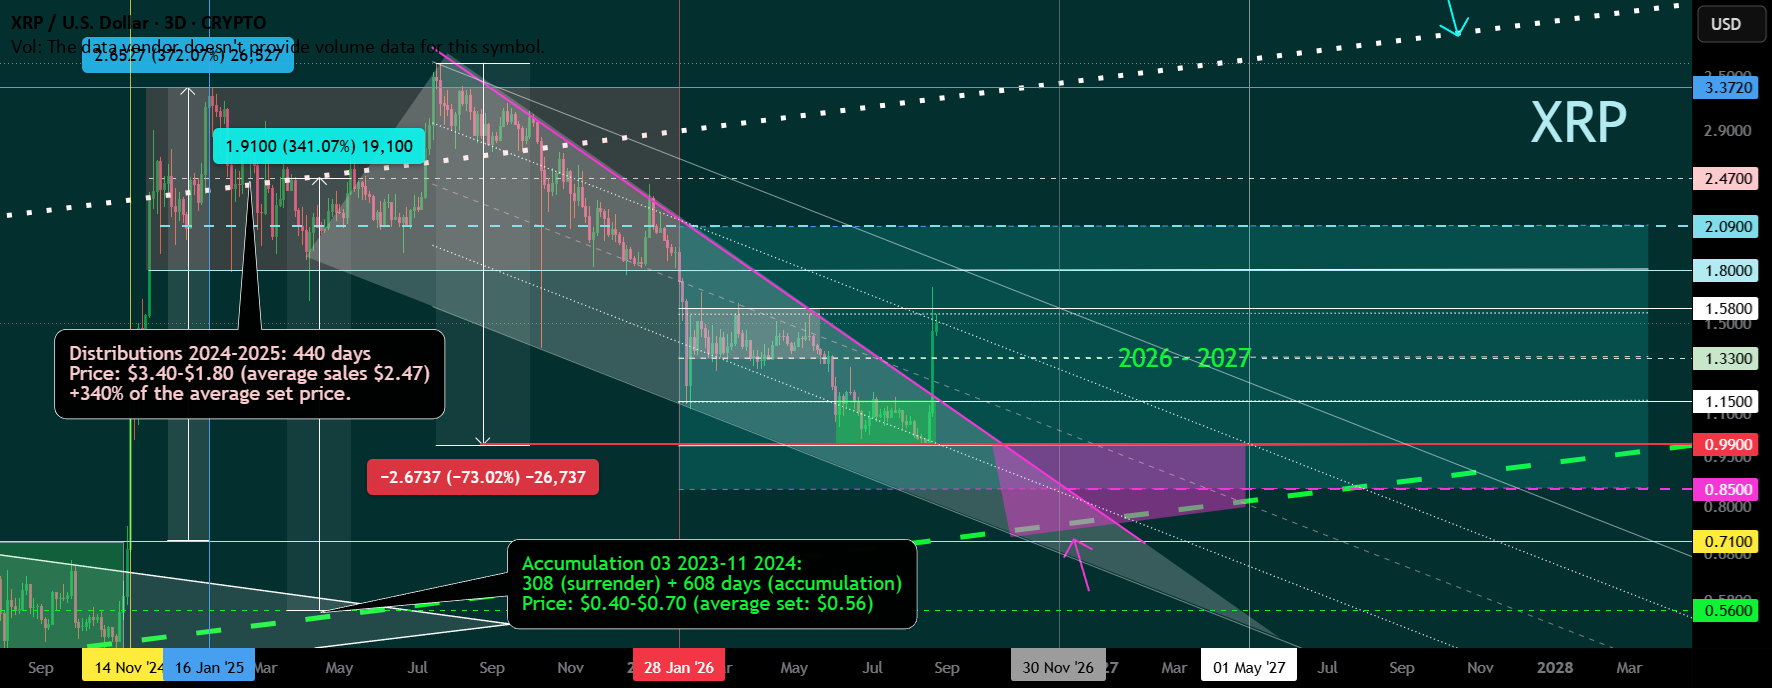
Following the broader macro shocks that characterized the crypto landscape in 2022, XRP entered a brutal phase of structural digestion. The period beginning in March 2023 was defined by an initial 308-day cycle phase characterized by severe capitulation. During this window, retail sentiment reached absolute zero. Weak hands, exhausted by the lack of upward momentum and macro headwinds, systematically dumped their holdings.
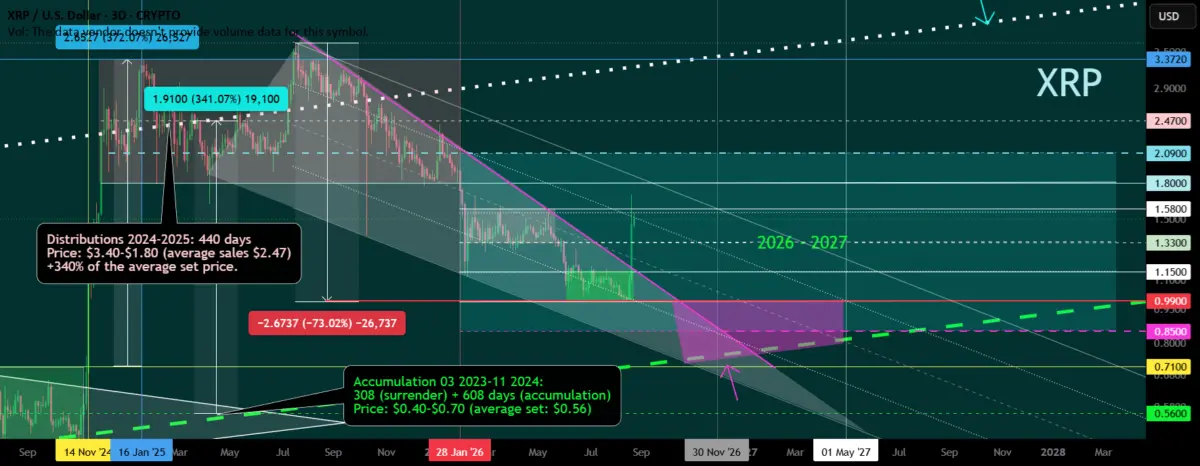
Volume dried up across major order books, and the asset traded sideways within a depressed horizontal band ranging from $0.40 to $0.70. This capitulation phase was not merely a random price fluctuation; it was a necessary market cleansing. It served to transfer ownership from impatient speculators to patient, high-conviction market participants—often categorized as smart money or institutional accumulators.
Phase 2: The Extended Accumulation Base (November 2023 – Late 2024)
Once the weak hands were purged, the market transitioned into a prolonged 608-day structural accumulation phase. Spanning well into late 2024, this phase tested the psychological endurance of even the most dedicated holders. Price action remained tightly bound within the $0.40 to $0.70 range, establishing a rock-solid macroeconomic floor.
The average accumulation price during this extensive basing period settled at approximately $0.56. Within this horizontal corridor, algorithmic market makers and large-scale holders quietly built massive inventory positions, absorbing supply without triggering explosive upward volatility. This extended period of sideways compression laid the structural energy necessary for the subsequent explosive upside move.
Phase 3: The Distribution Phase and Parabolic Markup (2024–2025)
When the accumulation springs finally uncoiled, the resulting upward expansion was both rapid and violent. The distribution phase, which unfolded across 2024 and 2025 over a roughly 440-day window, saw XRP break out of its multi-year range to register a staggering +372% pump.
As the asset transitioned from accumulation to public distribution, prices surged into a new range of $1.80 to $3.40. During this euphoric window, the average sales price for distributing entities hovered around $2.47. When measured against the baseline average accumulation price of $0.56, this distribution zone represented a monumental +340% return on investment for those who had accumulated during the depths of the 2023 capitulation cycle. However, as supply flooded back into the market to meet surging retail demand, the inevitable exhaustion set in, triggering the aggressive -72% secondary trend retracement that market participants are currently navigating.
Supporting Context & Metrics: Technical Indicators and Macro Structures
Navigating the current horizontal volatility channel requires more than just glancing at short-term charts; it demands an understanding of macro-technical overlays that have governed XRP’s price trajectory for years.
[2022-2023: Capitulation] ---> (Avg: $0.56) ---> [2024-2025: Distribution] ---> (Avg: $2.47 [+340%]) ---> [Current: -72% Correction & Horizontal Channel]The Three-Day Timeframe and Horizontal Volatility Channels
Analyzing XRP through a 3-day chart filters out the intraday market noise that frequently traps leverage traders. On this macro scale, the recent -72% retracement from the secondary trend high is not viewed as a catastrophic failure, but rather as a reversion toward a high-liquidity mean.
The asset is currently carving out a horizontal channel of potential volatility. In technical analysis, these expansive horizontal zones typically act as staging areas. They represent equilibrium zones where buyers and sellers fiercely contest fair value. Over the long term, these channels bifurcate into two distinct possibilities:
- Re-accumulation Zones: Where patient capital quietly absorbs remaining sell pressure in anticipation of a new macro impulse wave.
- Distribution/Capitulation Platforms: Where a breakdown in macro support could catalyze another wave of sharp liquidations.
Macro Trend Validation: Ascending Channels and Triangles
To fully grasp the significance of this trading zone, analysts must cross-reference current price behavior with broader historical perspectives, such as the global trend charts published in January 2026 and the foundational 2022 trading models.
XRP’s historical price action respects macro geometric boundaries. Ascending channel formations and multi-year symmetrical triangles dictate that long-term trend continuation relies heavily on holding higher lows during deep retracements. The current -72% correction has brought the asset back to critical structural test levels identified in these macro models. If the horizontal channel successfully holds as a long-term floor, it will mirror the foundational base-building process observed in early 2023, setting the stage for a structurally sound, multi-year ascending trajectory.
Official Statements and Market Perspectives
As the digital asset market grapples with this pivotal structural crossroads, industry analysts, quantitative researchers, and market commentators have weighed in on the implications of XRP’s current price positioning.
Prominent market analysts tracking the asset’s multi-year performance note that the psychology of market cycles remains stubbornly consistent. “The transition from a +372% parabolic expansion to a -72% retracement is textbook market behavior,” noted one independent quantitative strategist. “Retail investors frequently mistake macro consolidation channels for terminal decline. In reality, these horizontal volatility zones are where generational wealth is quietly positioned by those willing to endure the boredom of sideways price action.”
Furthermore, macro analysts reviewing the January 2026 global trend models emphasize that patience is the ultimate edge in current market conditions. Institutional commentary surrounding digital asset liquidity underscores the reality that after a heavy distribution phase (where average sales touched $2.47), the market requires a protracted cooling-off period. Order books must clear out leveraged longs, and market sentiment must reset from irrational exuberance back to skepticism before a sustainable, organic macro trend can resume.

Future Outlook: Navigating the Next Market Cycle
As the crypto market looks toward the horizon, the trajectory of XRP hinges entirely on how price action behaves within the established horizontal volatility channel over the coming months.
Bullish Scenario: The Re-Accumulation Blueprint
Should historical precedent repeat itself, the current phase of volatility compression will serve as a mirror image of the 2023 accumulation period. In this scenario, patience will be rewarded as the asset forms a durable macro bottom within the lower volatility bounds. As supply is gradually absorbed by long-term holders and institutional vehicles, the market will likely form a compressed base. Once volatility contracts to its absolute limit, an eventual bullish breakout could trigger a brand-new cycle of expansion, potentially challenging—and ultimately surpassing—previous cycle distribution highs.
Bearish Scenario: Macro Breakdown and Extended Capitulation
Conversely, risk management protocols dictate that market participants must remain vigilant. If macroeconomic headwinds intensify, or if broader crypto market liquidity contracts sharply, the horizontal channel could fail to hold as a structural floor. A decisive breakdown below key support could invalidate the multi-year ascending channel theories, plunging the asset back into a prolonged capitulation phase reminiscent of the darkest days of the 2022 bear market. Under this outcome, recovery timelines would be significantly extended, requiring traders to adopt a defensive capital preservation strategy.
Strategic Summary for Market Participants
The road ahead for XRP is fraught with both volatility and opportunity. The stark contrast between the $0.56 average accumulation price of the past and the $2.47 average distribution targets highlights the immense profit potential available to those who understand macro market cycles. However, realizing those gains requires steel discipline, an unwavering focus on macro technical structures (such as the 3-day horizontal channels), and a refusal to panic during periods of intense market capitulation. As the new cycle unfolds, market participants must monitor volume profiles, order book depth, and key macro support levels to determine whether XRP is currently building a launchpad for its next historic leg up or preparing for an extended winter.
Disclaimer
Disclaimer: The information, analysis, and publications provided in this article are for informational and educational purposes only and do not constitute financial, investment, trading, or any other type of advice or recommendation supplied, endorsed, or validated by TradingView or the publisher. Cryptocurrency trading and investing involve substantial risk of loss and are not suitable for every investor. You should conduct your own thorough research and consult with a qualified financial professional before making any investment decisions. Read more in the platform Terms of Use regarding investment decisions and trading risks.