Executive Overview
At the heart of this contraction is a confluence of fundamental and technical pressures. The technology sector—historically the primary engine of modern equity market appreciation—is currently grappling with severe headwinds, notably within the semiconductor ecosystem. Compounding these industry-specific challenges are mounting questions surrounding lofty artificial intelligence (AI) valuations, which have forced portfolio managers to reevaluate future earnings multiples against a backdrop of restrictive monetary policy.
Furthermore, global liquidity dynamics remain constrained as traders brace for pivotal corporate earnings reports, most notably from semiconductor titan Nvidia, alongside impending inflation prints and crucial signaling from the United States Federal Reserve. As trading desks position themselves defensively, the immediate technical landscape suggests that the path of least resistance remains skewed to the downside. A failure to defend psychological support thresholds could trigger an accelerated wave of liquidation, while bulls must achieve a decisive, volume-backed breakout above the multi-week trading range to invalidate the prevailing bearish structure.
Detailed Chronology & Price Action Dynamics
The Anatomy of Rejection: Unpacking the US100 Struggle at Resistance
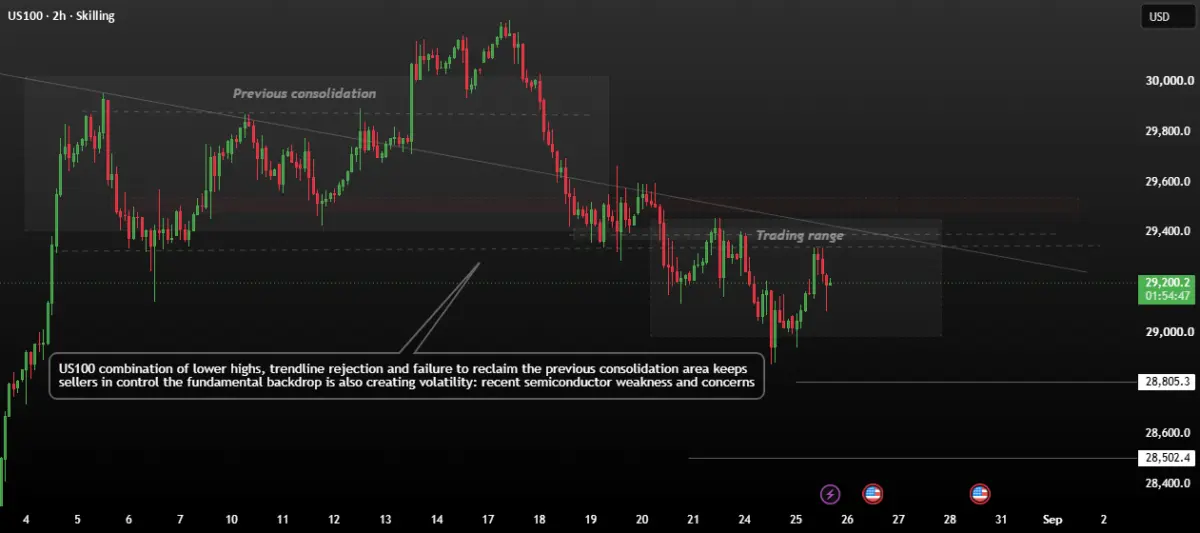
The current bearish phase on the US100 did not materialize in a vacuum; rather, it is the culmination of weeks of failed bullish attempts to reclaim key structural pivot points. Over recent trading sessions, price action has consistently adhered to a textbook lower-highs formation. Each recovery attempt has been methodically sold into by institutional participants, preventing the index from establishing a foothold above the pivotal descending trendline.
[29,600 Resistance Ceiling] ─── (Repeated Bullish Rejections)
           │
           ▼
[29,300 - 29,400 Pivot Zone] ── (Sellers Defending Rallies)
           │
           ▼
[29,000 Psychological Level] ── (Current Battleground)
           │
           ▼
[28,800 Support Floor] ─────── (First Line of Defense)
           │
           ▼
[28,500 Ultimate Support] ──── (Bearish Continuation Target)
The primary battleground continues to center around the 29,300–29,500 resistance corridor. Every time the index has probed the lower boundaries of this supply zone, selling volume has aggressively stepped in, illustrating that market participants view higher valuations as unsustainable under current conditions. This relentless distribution pattern has created a compressed trading range, squeezing intraday volatility while building pressure for a decisive directional breakout.
Breakdown of Key Technical Levels
To navigate the current market environment effectively, traders and risk managers are closely monitoring a defined set of support and resistance boundaries:
- Immediate Resistance: 29,300 / 29,500
- Major Overhead Supply Zone: 29,400 – 29,600
- Immediate Support: 28,800
- Secondary Support / Downside Target: 28,500
- Critical Inflection Point: 29,000 Psychological Threshold
Technically, the overarching narrative is defined by this repeated rejection from the upper boundary of the current trading channel. As long as the US100 fails to record a daily and weekly close above the 29,400–29,600 threshold, upside attempts will likely continue to encounter persistent selling pressure.
Conversely, the downside risk is rapidly materializing. A decisive, high-volume break below the 29,000 handle would effectively invalidate any remaining bullish consolidation arguments, likely triggering an aggressive wave of algorithmic stop-losses. Such a breakdown would clear the path for a swift bearish continuation toward the 28,800 support shelf, with the deeper 28,500 structural floor serving as the ultimate target for short-term bears.
On the flip side, a sustained, high-volume breakout and close above the 29,600 ceiling would fundamentally alter the technical landscape. Such a move would shatter the descending trendline, neutralize the sequence of lower highs, and potentially ignite a powerful short-squeeze recovery toward preceding multi-week highs.
Supporting Context & Sector Metrics
Semiconductor Weakness and the AI Valuation Dilemma
The technical deterioration observed in the US100 mirrors profound fundamental unease within the broader technology sector. For the past several quarters, the narrative driving equity markets higher has been inextricably linked to the explosive growth of artificial intelligence infrastructure. Chipmakers, cloud computing giants, and enterprise software developers have enjoyed unprecedented capital inflows, pushing valuations to historical extremes.
However, market sentiment has begun to experience a structural shift. Analysts and institutional investors are increasingly scrutinizing whether the astronomical capital expenditures dedicated to AI development will yield commensurate return-on-investment (ROI) timelines. This skepticism has hit the semiconductor industry particularly hard. As cyclical supply-demand dynamics normalize and investors demand tangible earnings growth rather than speculative projections, chip stocks have experienced outsized drawdowns. Because semiconductor heavyweights command a disproportionate weighting within the US100 index, any weakness in this sub-sector inevitably exerts severe gravitational pull on the broader benchmark.
Macroeconomic Crosscurrents: Nvidia Earnings, Inflation, and the Fed
Beyond sector-specific headwinds, the macroeconomic backdrop is characterized by profound caution. Market participants are acutely aware that external catalysts possess the capacity to induce sharp, high-volatility repricing across all asset classes.
Chief among these upcoming catalysts is the highly anticipated earnings report from Nvidia. As the undisputed bellwether for the artificial intelligence revolution, Nvidia’s financial results and forward-looking guidance are viewed not merely as corporate disclosures, but as a referendum on the health of the entire global technology ecosystem. Any hint of decelerating demand, supply chain constraints, or margin compression could send shockwaves through tech-heavy indices.
Simultaneously, traders remain hyper-focused on upcoming macroeconomic data releases, specifically regarding inflation metrics. The trajectory of consumer and producer price indices continues to dictate the policy path of the United States Federal Reserve. With central bank officials maintaining a data-dependent stance and hedging their rhetoric against premature monetary easing, the prospect of "higher-for-longer" interest rates remains a persistent threat to equity valuations. Elevated borrowing costs diminish the present value of future corporate cash flows, disproportionately punishing growth-oriented technology companies whose valuations are heavily skewed toward long-term earnings potential.
Official Statements & Industry Perspectives
Market strategists, quantitative analysts, and institutional portfolio managers have increasingly voiced concerns regarding the precarious equilibrium currently defining the US100 index. While opinions vary on the ultimate depth of the current corrective phase, a broad consensus exists regarding the fragile nature of current valuations.
Institutional Commentary on Tech Valuations
Speaking at a recent global investment symposium, Chief Equity Strategist at a prominent Wall Street institution remarked:
"We are witnessing a classic textbook transition from unbridled speculative enthusiasm to cautious risk management. The technology sector has been the undisputed leader of this multi-year bull run, but leadership comes with a cost: extreme valuation multiples. When macroeconomic variables—such as persistent interest rate uncertainty and shifting liquidity—converge with cyclical fatigue in semiconductor demand, markets naturally test structural support levels. The inability of the US100 to push past the 29,500 resistance zone tells us that institutional buyers are stepping aside, waiting for a more attractive risk-reward entry point closer to major structural floors."
Another senior portfolio manager specializing in growth equities emphasized the importance of upcoming earnings catalysts:
"The market is currently holding its collective breath. Nvidia’s upcoming report is the ultimate litmus test for the AI trade. If guidance validates the bull case, we could see an aggressive relief rally that shatters the descending trendline. However, if margins disappoint or enterprise spending shows signs of fatigue, the correction we are seeing now in the US100 will likely prove to be merely the opening act of a deeper cyclical consolidation."
Future Outlook & Strategic Roadmap
As the US100 navigates this critical crossroads, market participants must prepare for heightened volatility and potential trend acceleration. The interplay between technical exhaustion and fundamental uncertainty creates an environment where disciplined risk management is paramount.
Bullish Reversal Scenario
For the bulls to regain structural control, several key milestones must be achieved:
- Defense of Support: The immediate support zone around 28,800 must hold against any aggressive selling pressure.
- Momentum Shift: Intraday price action must successfully neutralize the descending trendline that has dictated recent lower highs.
- Volume-Backed Breakout: A decisive, high-volume daily and weekly close above the 29,400–29,600 resistance ceiling is mandatory to invalidate the bearish continuation pattern.
- Catalyst Alignment: Favorable earnings surprises from key technology bellwethers and softer-than-expected inflation prints must align to provide the fundamental fuel for an extended recovery.
Bearish Continuation Scenario
Conversely, should the market succumb to prevailing headwinds, the downside trajectory will likely unfold according to the following roadmap:
- Breach of 29,000: A failure to sustain bids above the psychological 29,000 milestone will likely trigger cascading algorithmic liquidations.
- Targeting 28,800: Accelerated selling will rapidly test the primary support shelf at 28,800, where short-term traders will look for temporary stabilization.
- Deep Correction to 28,500: Continued macroeconomic pressure, disappointing corporate guidance, or hawkish central bank signaling could drive the US100 down to the secondary support target at 28,500, representing a significant test of broader market health.
Conclusion
In summary, the US100 stands at a defining technical and fundamental precipice. Trapped beneath a formidable resistance zone and besieged by semiconductor weakness, AI valuation concerns, and macro uncertainty, the index requires either a powerful fundamental catalyst or a sweeping exhaustion of selling pressure to break its current range-bound imprisonment. Traders are advised to monitor key pivot levels with strict discipline, avoiding premature directional bets until a definitive, volume-confirmed breakout or breakdown materializes.
Disclaimer: The information, analysis, and opinions expressed in this report are provided for informational and educational purposes only and do not constitute financial, investment, trading, or professional advice. Financial markets involve substantial risk of loss, and past performance is not indicative of future results. Readers should conduct their own thorough research and consult with a licensed financial advisor before making any investment or trading decisions.