Executive Overview
According to recent technical breakdowns provided by market analysts at MyCryptoParadise, multiple confluence factors suggest that SHIB may be primed for a significant short-term relief rally or a broader upward expansion. Across the 4-hour (4H), daily, 1-hour (1H), and lower timeframes, a confluence of technical indicators—including descending channel breakouts, Change in State of Delivery (CISD) confirmations, heavy volume absorption, and MACD bullish divergences—is painting an increasingly optimistic picture for the token’s bulls.
However, professional trading demands discipline. While the technical probability of a bullish reaction is climbing, analysts emphasize that chasing price action without proper confirmation or risk management remains a perilous endeavor. This report provides a comprehensive investigative overview of the current Shiba Inu market structure, examining the technical confluence, volume metrics, potential price targets, risk management parameters, and the broader outlook for the asset in the coming sessions.
Detailed Chronology of the Current SHIB Market Structure
To understand where Shiba Inu is heading, we must examine the step-by-step evolution of its recent price action across multiple timeframes. The current setup did not form overnight; rather, it is the culmination of weeks of sustained selling pressure meeting unyielding institutional and retail demand at foundational support levels.
1. The Macro Foundation: Daily and 4H Support Defense
The narrative began forming as SHIB retraced from previous local highs, sliding down into established 4H and Daily support areas. Historically, these zones have acted as historical springboards for buyers. As the price hovered near these critical floors, bears attempted to drive the token lower to trigger long liquidations and break market morale. Instead, buyers stepped in aggressively, laying the foundation for a potential reversal.
2. The 1H Breakout and CISD Confirmation
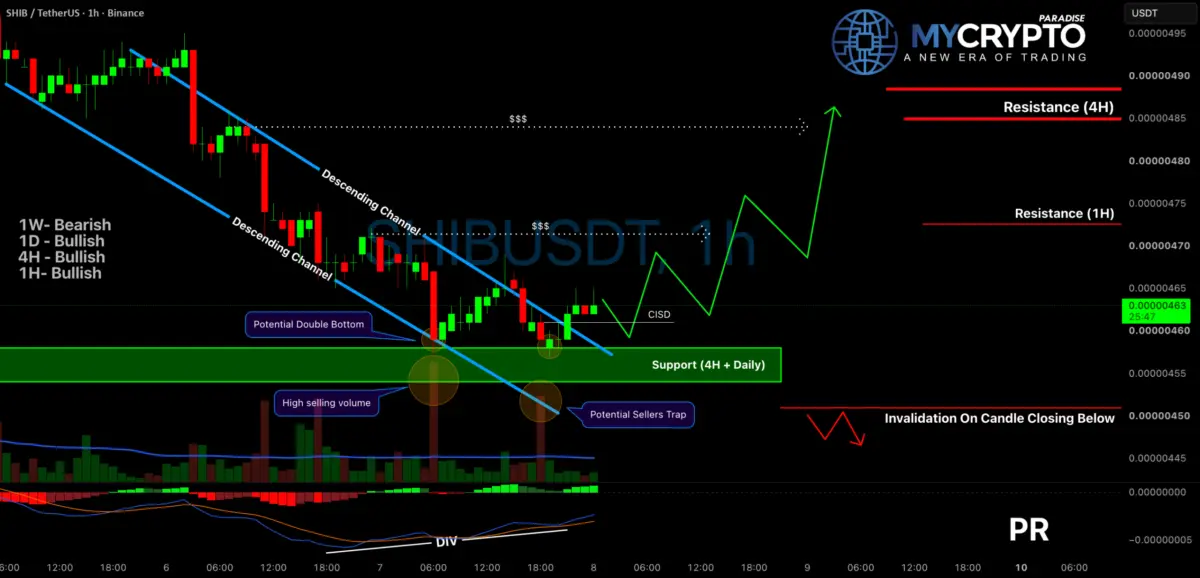
Moving down to the 1-hour timeframe, the technical narrative shifted more dynamically. SHIB successfully breached the upper boundary of a persistent descending channel that had constrained price action for days. Accompanying this structural break was a bullish CISD (Change in State of Delivery), a key indicator pointing to a shift in institutional order flow from net-short to net-long.
3. The Volume Anomaly: Absorbing the Selling Pressure
One of the most telling developments during this breakout phase was the behavior of trading volume. Unusually high selling volume flooded the order books right as the price tested the lower boundaries. Ordinarily, high selling volume at support signals a breakdown. However, when heavy selling volume appears, but the price stubbornly refuses to continue lower, it reveals a critical market dynamic: aggressive absorption. Sellers were aggressively dumping tokens, yet deep-pocketed buyers were quietly soaking up every single unit of supply. This phenomenon frequently precedes a sudden "short trap," where trapped bears are forced to buy back their positions as the price reverses sharply upward.
4. Momentum Shift: MACD Divergence and Double-Bottom Formation
Adding further weight to the bullish thesis, a classic bullish divergence materialized on the Moving Average Convergence Divergence (MACD) indicator. While SHIB’s price action printed lower lows or flat tests during localized dips, the MACD momentum histograms and signal lines printed higher lows. This classic divergence signaled that underlying bearish momentum was rapidly evaporating. Concurrently, a potential double-bottom structure began carving itself directly into the support zone, offering a classic geometric pattern confirmation for technicians eyeing a long entry.
Supporting Context & Technical Metrics
To fully evaluate the validity of the SHIB setup, traders must look beyond basic chart patterns and analyze the underlying mechanics of liquidity, volume profiles, and quantitative risk metrics.
Decoding the Volume and Liquidity Dynamics
In modern crypto markets, liquidity is king. Major market participants—often referred to as "smart money"—rarely push prices higher in a vacuum; they require liquidity (resting stop-losses and breakout orders) to fill large buy and sell orders.
The heavy selling volume observed during the recent descending channel breakout indicates that breakout-sellers and late shorts piled into the market, assuming the support level would fail. By trapping these aggressive bears directly above key support, buyers have engineered a textbook liquidity pool. If momentum pushes SHIB past immediate resistance levels, these trapped shorts will face margin pressure, triggering cascading liquidations that can rapidly accelerate the upside move.
Target Mapping: Where is SHIB Headed?
Technical analysts mapping out the upside expansion have identified two primary liquidity pools and resistance zones that will act as natural magnets for price action:
- First Upside Target (0.00000471): The initial barrier sits at approximately 0.00000471. This zone coincides with 1H liquidity clusters and minor local resistance. Expect some choppy price action or localized profit-taking as the token approaches this level.
- Second Major Target (0.00000484): If buyers sustain momentum and slice through the initial target, the primary macro target rests at approximately 0.00000484. This level features dense 4H resistance and substantial resting liquidity, making it a logical zone for swing traders to take profits or reevaluate market conditions.
Entry Strategies and Risk-to-Reward Parameters
Entering a trade based on multiple technical signals requires strict adherence to risk management principles. Analysts have outlined two primary approaches for traders looking to position themselves in SHIB:
- The Aggressive Approach: Traders opting for an immediate entry around current market prices must accept a higher degree of short-term volatility. To maintain a healthy risk-to-reward ratio, the invalidation level (stop-loss) must be strictly placed below the most recent swing low.
- The Conservative (Retest) Approach: For those prioritizing capital preservation, waiting for a healthy pullback toward the Fibonacci golden-ratio retracement zone is the preferred strategy. By allowing the price to retrace and confirm support before entering, traders can secure a superior entry price. For this setup, the invalidation area can be tightly managed around 0.00000451, depending on the exact confirmation signals received during the pullback.
Expert Perspectives and Trading Psychology
Navigating volatile altcoin markets requires more than just drawing lines on a chart; it demands absolute emotional control. Market analysts continually stress that confluence does not guarantee a 100% win rate—it merely shifts statistical probabilities in the trader’s favor.
The Dangers of FOMO and Chasing Price Action
When multiple bullish signals—such as a descending channel breakout, CISD, MACD divergence, and a double-bottom—appear simultaneously, retail traders frequently succumb to Fear Of Missing Out (FOMO). Jumping blindly into a surging market without waiting for proper structural confirmation often results in buying local tops right before a corrective pullback.
Professional trading outfits, such as MyCryptoParadise, repeatedly remind their communities that consistency in cryptocurrency trading is born from patience. High-probability opportunities naturally emerge when structure, momentum, liquidity, and risk management completely align. Forcing trades out of boredom or impatience is the fastest way to erode trading capital.
Future Outlook: What Lies Ahead for Shiba Inu?
As Shiba Inu tests the resolve of both bulls and bears at this crucial juncture, the coming days will likely dictate the medium-term trajectory of the token.
If the current support holds and buyers successfully absorb the remaining overhead supply, we could witness a sharp, aggressive rally toward the 0.00000471 and 0.00000484 targets. Such a move would not only validate the multi-timeframe bullish divergence and channel breakout, but it would also restore confidence to the broader meme coin sector, which often actsas a high-beta barometer for speculative retail risk appetite.
Conversely, if macroeconomic pressures or unexpected sell-offs cause a breakdown below the established invalidation levels (specifically sub-0.00000451), the bullish thesis would be officially invalidated, prompting a swift reassessment of market health and potentially paving the way for a deeper leg down.
Summary Checklist for Traders:
- Monitor Support Defense: Ensure buyers continue to defend the daily and 4H support zones actively.
- Watch Volume Profiles: Look for declining volume on pullbacks and expanding volume on upward impulses.
- Respect Invalidation Levels: Never remove or widen stop-loss parameters; protect trading capital above all else.
- Exercise Patience: Allow the market to print its confirmations rather than chasing speculative green candles.
By combining rigorous technical analysis with disciplined risk management, traders can navigate the evolving Shiba Inu landscape effectively, turning market volatility into calculated opportunity.
Disclaimer: The information provided in this article is for educational and informational purposes only and does not constitute financial, investment, or trading advice. Cryptocurrency trading involves substantial risk of loss and is not suitable for every investor. Always conduct your own thorough research and consult with a licensed financial advisor before committing capital to digital assets.