Executive Overview
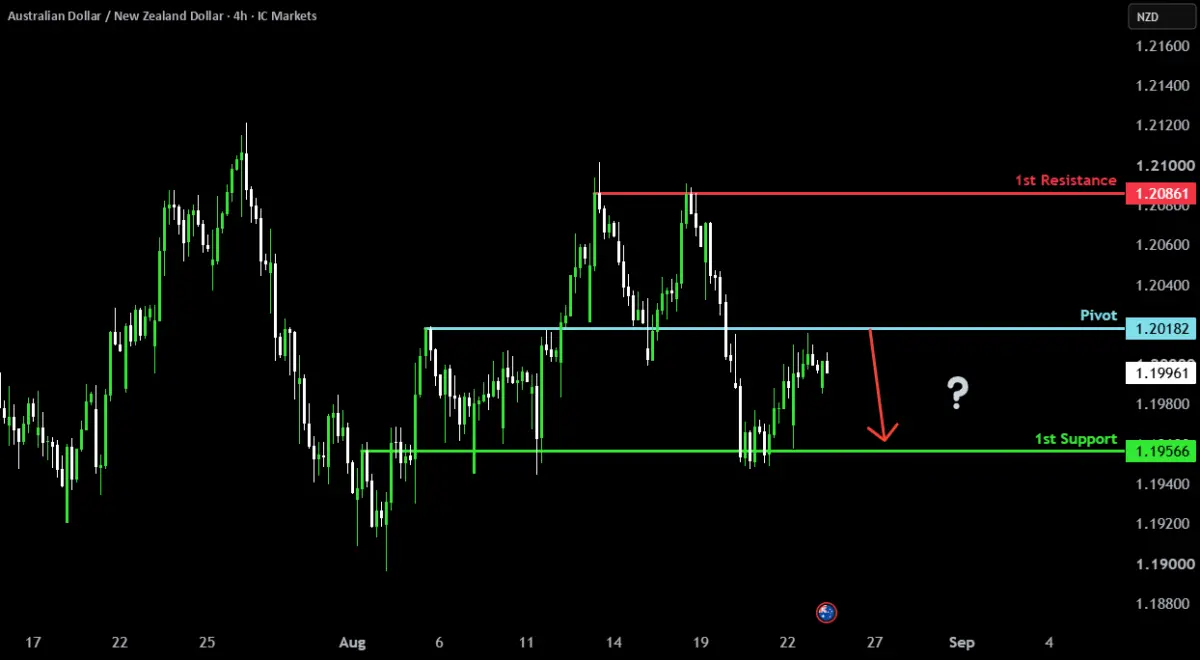
This pivotal level represents a powerful confluence of overlap resistance, combining historical price ceilings with psychological trading interest. Market strategists point out that the inability of the currency pair to sustain momentum above this threshold increases the statistical probability of a bearish reversal. Should the selling pressure intensify as anticipated, price action could cascade downward toward the 1.2000 psychological barrier before ultimately targeting the 1st Support level mapped at 1.19566, a zone historically recognized for offering robust pullback support. Conversely, bulls maintaining an aggressive stance would need to break and hold above the 1st Resistance level positioned at 1.20861 to invalidate the current near-term bearish bias.
This comprehensive technical report delves into the intricate mechanics driving the current AUD/NZD valuation, analyzes the quantitative metrics underpinning key support and resistance zones, and provides a professional breakdown of the broader market implications for forex traders navigating the Antipodean currency crosses.
Detailed Chronology: Price Action and the Battle at the Pivot
To fully comprehend the gravity of the current rejection at the 1.20182 pivot, it is essential to trace the chronological sequence of price developments that have shaped the AUD/NZD chart over recent sessions.
The Buildup and Approach to Resistance
During the early sessions of the current trading week, the AUD/NZD pair exhibited steady bullish momentum, gradually recovering from earlier intraday lows. This upward trajectory was fueled by shifting interest rate expectations between the Reserve Bank of Australia (RBA) and the Reserve Bank of New Zealand (RBNZ), alongside shifting risk sentiment across global equity markets. As buyers steadily stepped in, the exchange rate climbed methodically toward the 1.20182 marker.
The Rejection Phase
Upon approaching the 1.20182 pivot, momentum visibly decelerated. Technical traders had already flagged this zone as an overlap resistance level—an area where previous support floors had historically inverted into formidable overhead supply. As algorithmic execution models and manual short-sellers initiated sell orders, the currency pair encountered heavy selling pressure. The resulting rejection candlestick formation signaled a lack of buying conviction at higher valuations, halting the advance in its tracks.
Current Intraday Trajectory
In the wake of this rejection, price action has begun to slope downward, breaking initial intraday micro-support levels. Market participants are now closely monitoring whether the pair can orchestrate a sustained bearish extension toward the primary downside target. The progression of lower highs and lower lows on shorter-term timeframes suggests that sellers are currently in control of the intraday momentum, setting the stage for a test of the lower technical boundaries.
Supporting Context & Metrics: Decoding Key Technical Levels
In technical analysis, precision is paramount. The mathematical boundaries governing the current AUD/NZD setup provide clear risk-to-reward parameters for active market participants. Below is a detailed breakdown of the critical levels defining the current market structure:
[AUD/NZD Technical Map]

   Resistance Levels:
   -------------------------------------------------
   1st Resistance : 1.20861 (Extended Supply Zone)
   -------------------------------------------------
   Pivot Point    : 1.20182 (Overlap Resistance / Rejection Point)
   -------------------------------------------------
   1st Support    : 1.19566 (Pullback Support / Primary Target)
   -------------------------------------------------
1. The Pivot: 1.20182
The pivot level serves as the fulcrum for current market sentiment. By definition, an overlap resistance level occurs when a price zone that previously acted as a floor (support) is breached and subsequently repurposed as a ceiling (resistance). The firm rejection at 1.20182 validates this level’s historical significance, confirming that market participants view fair value below this threshold under current conditions.
2. The 1st Support: 1.19566
Positioned approximately 61 pips below the pivot, the 1st Support level at 1.19566 represents a vital pullback support zone. In bullish or sideways trending environments, pullback supports are areas where prices temporarily retrace before resuming their primary direction, or where buyers step in to defend institutional profit targets. If the current downward correction unfolds as projected, this level will serve as the primary litmus test for buyer interest. A decisive break below 1.19566 would open the door for accelerated losses toward deeper structural supports.
3. The 1st Resistance: 1.20861
Should macroeconomic catalysts or unexpected shifts in risk sentiment drive the currency pair higher, the 1.20861 mark stands as the 1st Resistance. This level guards against runaway bullish breakouts and represents the next logical ceiling where institutional sellers are likely to replenish short positions. A daily or weekly close above 1.20861 would fundamentally neutralize the current bearish thesis and force a re-evaluation of the broader trend structure.
Macroeconomic Drivers and Inter-Market Dynamics
While technical indicators provide the roadmap for trade execution, the underlying macroeconomic environment supplies the fuel. The AUD/NZD cross is heavily influenced by the economic health, commodity exposure, and monetary policy divergences of Australia and New Zealand.
The Trans-Tasman Monetary Policy Divergence
Both the RBA and the RBNZ have navigated post-inflationary economic cycles with cautious, data-dependent stances. However, nuanced differences in labor market data, housing sector resilience, and consumer spending have caused currency traders to constantly reprice the relative value of the Australian Dollar versus the New Zealand Dollar.
- The Australian Dollar (AUD): Heavily tied to global industrial demand, Chinese economic stimulus measures, and bulk commodity exports (such as iron ore, coal, and liquefied natural gas), the Aussie dollar frequently acts as a high-beta proxy for global risk appetite.
- The New Zealand Dollar (NZD): Often referred to as the "Kiwi," the NZD is closely linked to agricultural exports, particularly dairy products via the Global Dairy Trade (GDT) price index, as well as domestic economic adjustments regarding housing and migration trends.
When these two closely linked economies diverge even slightly in their growth metrics, the AUD/NZD pair experiences notable volatility, making technical levels like the 1.20182 pivot crucial reference points for managing risk.
Professional Risk Management and Market Execution
Navigating currency crosses requires disciplined risk management, particularly when trading near established technical boundaries. Professional market makers and institutional desks adhere to strict protocols when engaging in mean-reversion or trend-continuation strategies around pivot points.
Risk-to-Reward Considerations
For traders considering a short position following the rejection at the 1.20182 pivot, a logical stop-loss placement would reside just above the recent swing high or the 1.20861 resistance level. Conversely, profit targets are typically anchored near the 1.19566 support zone. This setup offers a structurally sound risk-to-reward ratio, ensuring that potential losses are strictly controlled should unexpected volatility invalidate the technical setup.
The Role of Liquidity and Execution
In modern forex trading, execution quality can significantly impact net profitability. Platforms specializing in transparent trading solutions—such as institutional-grade electronic communication networks (ECNs)—provide the deep liquidity and narrow spreads necessary to execute precision entries around tight pivot zones. Slippage and latency can erode margins, making the selection of a reliable execution venue critical for intraday and swing traders alike.
Future Outlook: Scenarios for the AUD/NZD Moving Forward
As the trading week progresses, market participants are weighing two primary scenarios for the AUD/NZD pair:
Scenario A: The Bearish Pullback (Primary Outlook)
In alignment with the recent rejection at the 1.20182 pivot, price action continues to drift lower. Sellers maintain pressure on the market, driving the currency pair through intermediate intraday levels. The primary downside objective remains the 1.19566 pullback support level. Upon reaching this zone, traders will monitor for signs of exhaustion, stabilization, or bullish bounces. A failure to hold 1.19566 could trigger a broader liquidation wave toward deeper support tiers.
Scenario B: The Bullish Invalidiation (Alternative Outlook)
Should broader macroeconomic data or unexpected cross-flows inject sudden buying momentum into the market, the AUD/NZD pair could stage a secondary assault on the 1.20182 pivot. A decisive, high-volume break above this level would negate the rejection thesis, shifting immediate focus toward the 1.20861 resistance barrier. Swing traders holding short positions would need to react swiftly to protect capital under this alternative scenario.
Regulatory Disclaimer and Notice of General Commentary
Disclaimer: The opinions, news, research, analyses, prices, and other information contained within this market commentary constitute general market commentary and do not constitute formal financial, investment, trading, or personal advice. This publication is provided on an "as-is" basis for informational purposes only and should not be construed as an offer, solicitation, or recommendation to buy or sell any financial instrument.
Past performance is not a reliable indicator of future results. Forward-looking scenarios and technical projections are based on the reasonable beliefs of market analysts and third-party providers; however, actual market outcomes may differ materially. Neither the publishing entities nor associated brokerage platforms assume liability for any financial loss or damages arising directly or indirectly from the use of, or reliance upon, the information provided in this technical report. Readers are strongly encouraged to conduct their own independent due diligence and consult with a licensed financial advisor before executing any trades in the foreign exchange market.