rifanmuazin is a reporter for DeBitcoin covering Crypto Market Analysis. She/He is based in Indonesia.
9 August 2026 • 7 min read
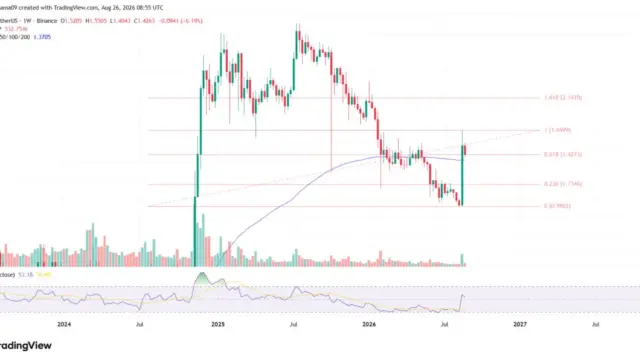
Cardano (ADA) stands at a critical technical and structural juncture. Following a period of prolonged downward pressure that dragged the asset toward multi-year lows, ADA has staged a modest recovery, climbing approximately 14% over a seven-day window to trade near the $0.198 level. Despite this short-term reprieve, the token remains severely depressed relative to its historic bull market performance, hovering roughly 94% below its all-time high of $3.10 recorded in September 2021.
Executive Overview
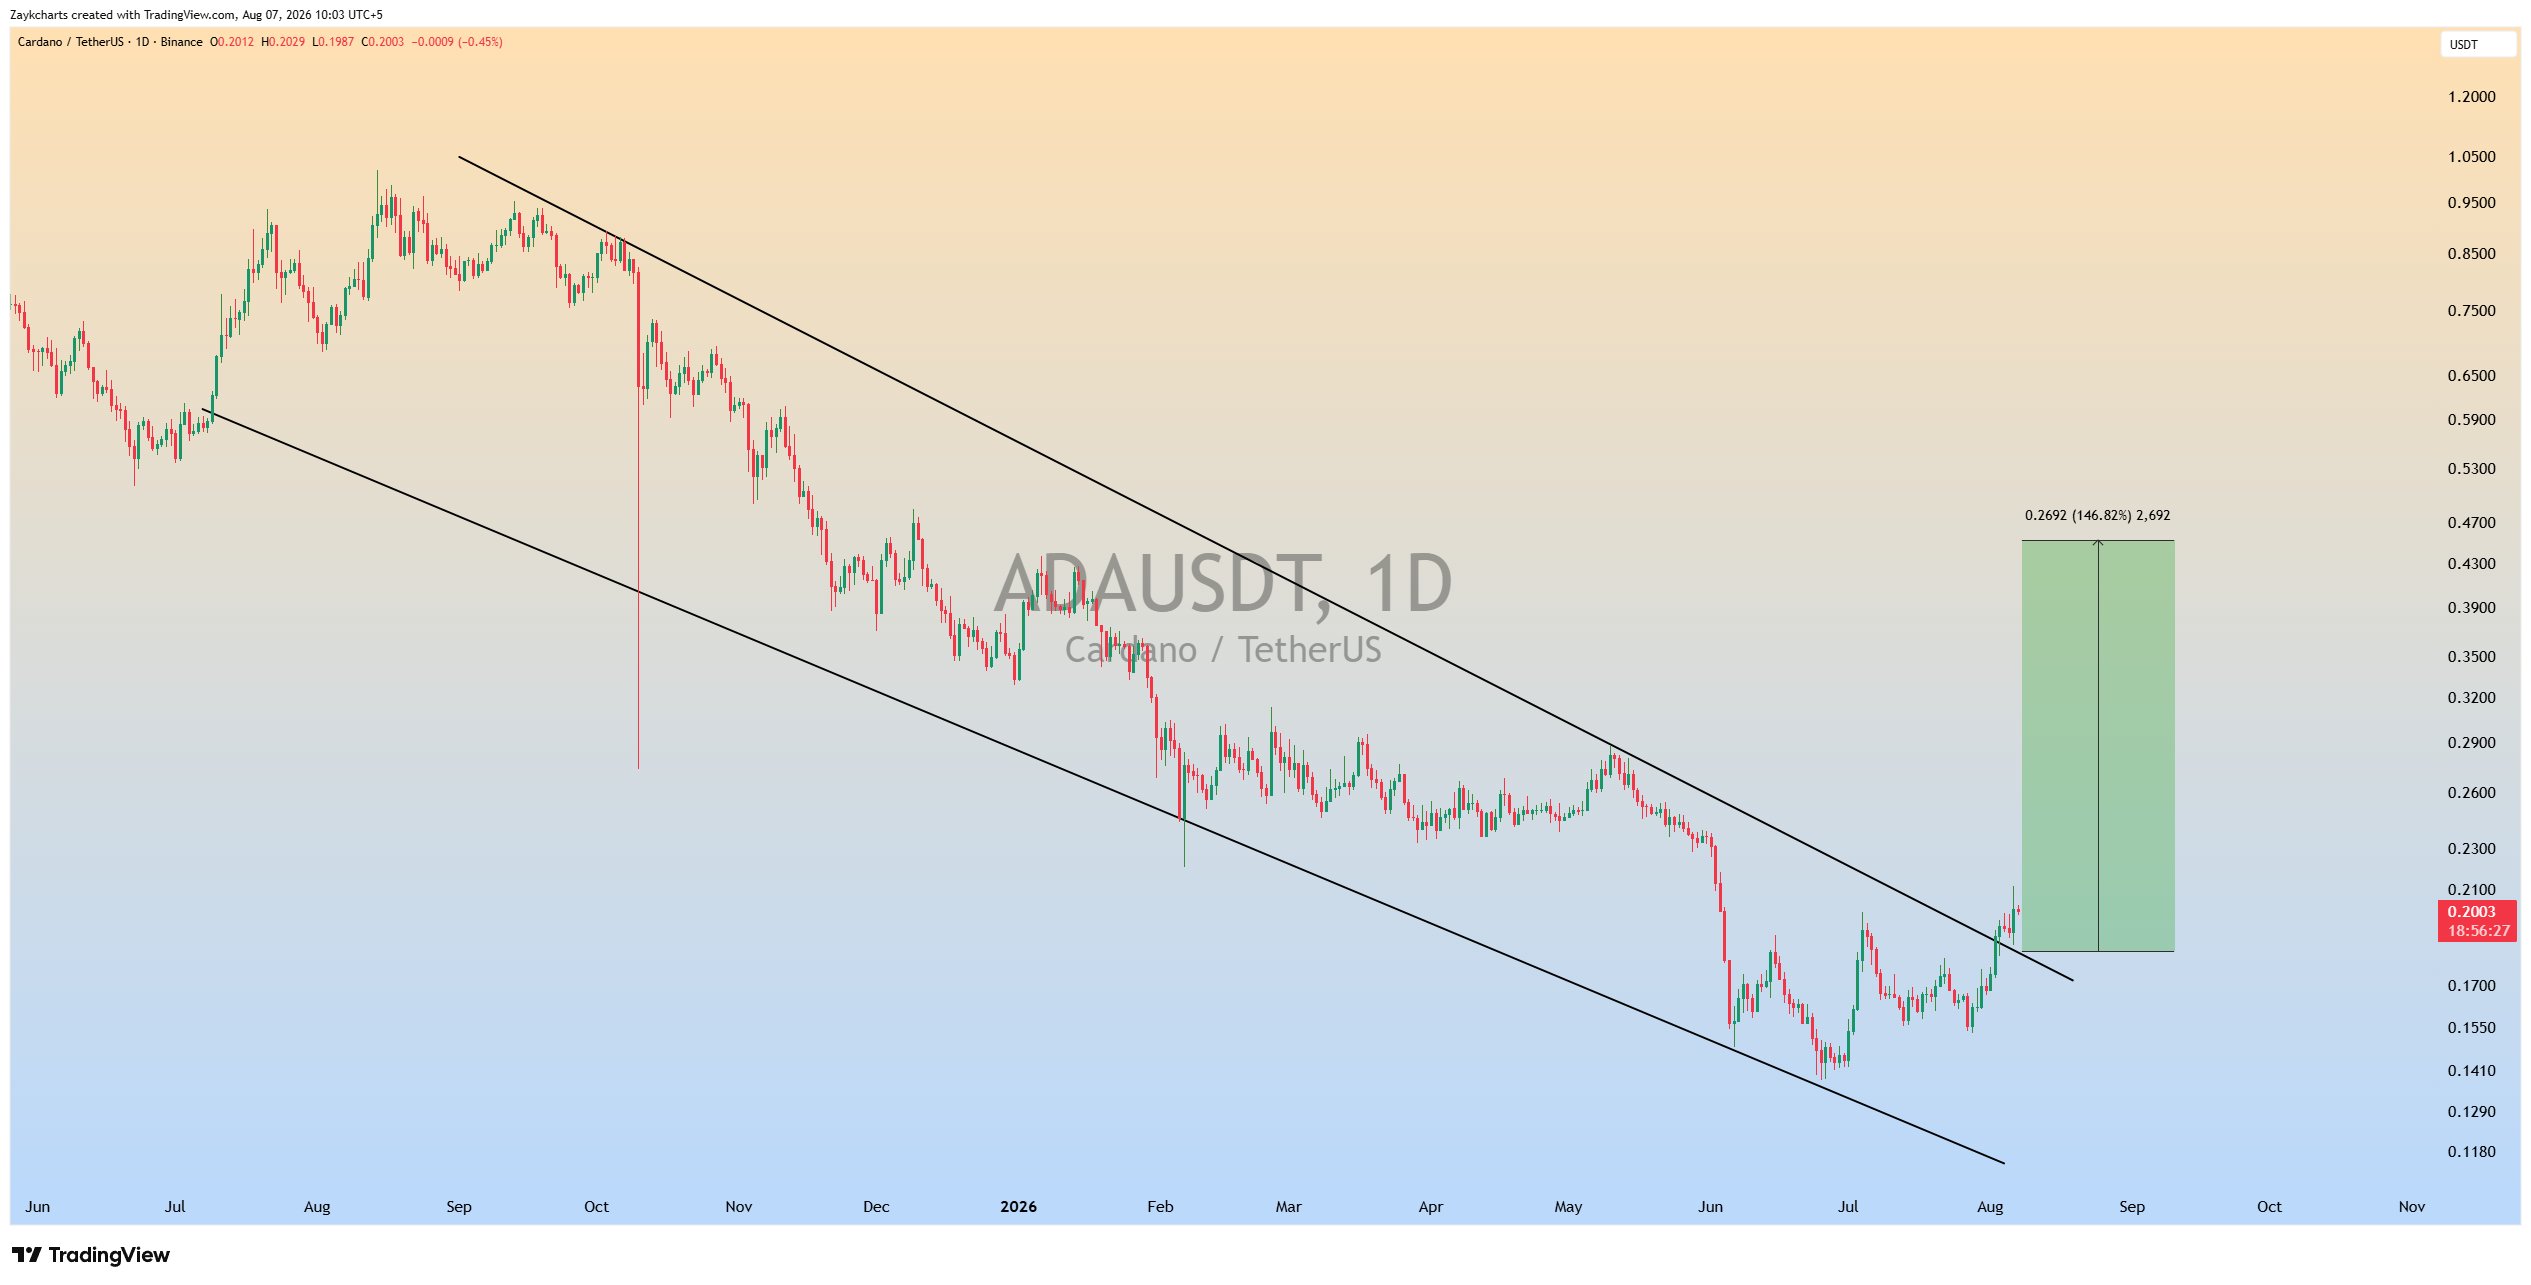
Market participants and technical analysts present vastly diverging outlooks for Cardano’s medium-to-long-term trajectory. Technical chartists highlight a clean breakout from a multi-month descending trend channel, projecting that sustained bullish momentum could unlock a rally toward $0.47—a potential 147% surge from current valuation levels. Conversely, conservative consensus models project more modest gains through 2026, anchoring the asset’s fair value between $0.22 and $0.30.
Compounding this technical tension is an emerging divergence on the blockchain itself: while retail sentiment has buoyed spot prices off recent lows, on-chain data from market intelligence platform Santiment reveals a pronounced drop in large-holder ("whale") activity. High-value transactions exceeding $100,000 have dwindled to single digits, signaling that institutional investors and major capital allocators remain hesitant to back the current rebound without further macro and structural validation.
Detailed Chronology: From Multi-Year Lows to Channel Breakout
Cardano’s price discovery throughout mid-2024 has been defined by persistent sell-side liquidity, culminating in late-June troughs that tested multi-year support structures. However, price action began shifting during the final weeks of July and early August as buyers stepped in to defend critical support zones, initiating a sustained relief rally.
Late-June Bottom: ADA hits local multi-year lows, experiencing severe liquidity drain alongside broader altcoin market drawdowns. Selling pressure exhausts near critical multi-year support levels.
Late-July Stabilization: Spot markets absorb overhead supply, forming a rounded bottom structure. Accumulation patterns emerge on lower timeframes as selling pressure abates.
Early-August Impulse: ADA breaks above the upper bound of its downward-trending channel. The initial breakout sequence delivers a swift 13% vertical expansion, shifting short-term market structure from bearish to market-neutral.
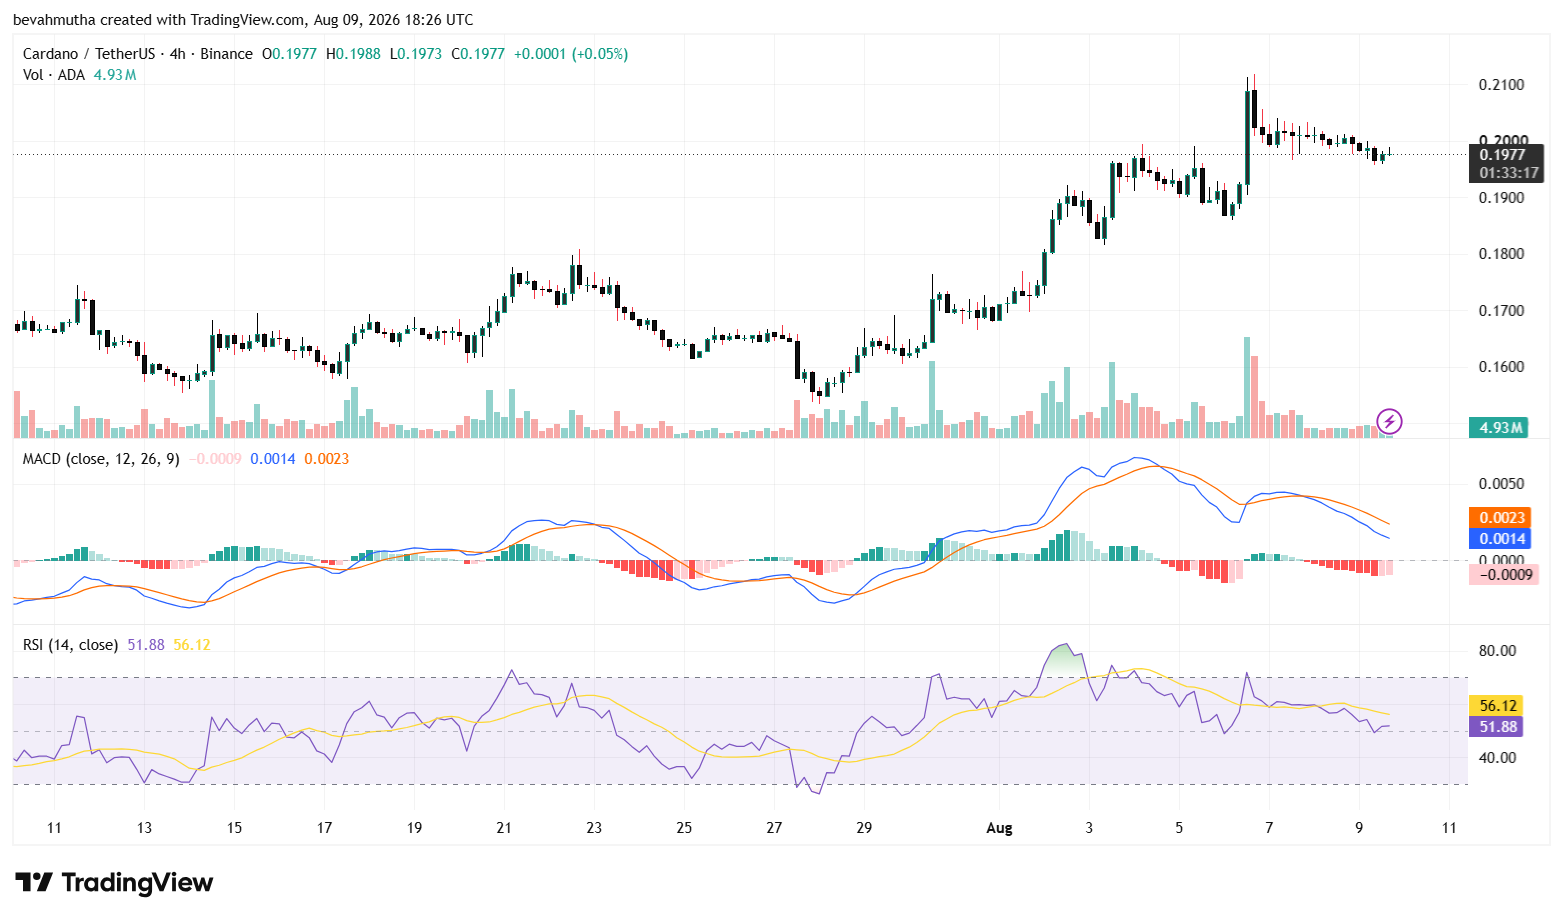
Mid-August Consolidation: Following a 14% weekly advance, ADA consolidates just below the $0.200 psychological barrier, printing $0.1983 amid tight four-hour candle ranges (+0.35% intraday).
While the initial 13% extension cleared the upper boundary of the long-standing descending channel, the asset must hold this breakout zone on weekly closes to validate the shift in higher-timeframe market structure. A failure to build market acceptance above this level risks a bull trap and subsequent re-entry into the multi-month channel.
Supporting Context & Metrics: Technical and On-Chain Divergence
Technical Indicator Profile
A granular inspection of Cardano’s four-hour and daily charts reveals a nuanced technical backdrop characterized by balanced oscillators and lagging momentum indicators.
   Indicator            Value / Status           Market Interpretation
   ─────────────────────────────────────────────────────────────────────────────
   Relative Strength    53.16                    Neutral-Bullish; room for
   Index (RSI)                                   upside expansion.

   MACD Line            Below Signal Line        Weak short-term momentum;
                                                 lagging price action.

   Key Resistance       $0.200, $0.220, $0.250   Layered supply overhead;
   Levels               $0.280, $0.300           major hurdle at $0.300.

   Primary Support      $0.185 - $0.190          Breakout retest zone; must
   Zone                                          hold to sustain structure.
Relative Strength Index (RSI): The 14-period RSI currently prints at 53.16. Resting comfortably above the median 50-line, the index reflects mild bullish control without entering overbought territory (>70). This suggests there is sufficient technical room for further upward price discovery before encountering momentum exhaustion.
Moving Average Convergence Divergence (MACD): In contrast to the RSI, the MACD line continues to float below its signal line on intermediate timeframes. This negative alignment points to weak underlying momentum during the latest sub-$0.20 push, signaling that buy volume has yet to decisively back the breakout.
Key Resistance Structure: To maintain its upward trajectory toward macro targets, ADA must systematically clear a series of overhead supply zones:
$0.200: Psychological barrier and immediate pivot point.
$0.220 – $0.250: Intermediate distribution zone marked by historical order block imbalances.
$0.280 – $0.300: Major macro resistance; breaking $0.300 would signal a definitive trend shift on the high-timeframe charts.
On-Chain Metrics: The Whale Activity Deficit
While technical charts display encouraging breakout formations, on-chain telemetry provided by Santiment highlights a stark contraction in smart-money participation.
During previous market expansions and major price corrections, Cardano regularly registered between 50 and 100 whale transactions per day (defined as transfers exceeding $100,000 in value). These surges in institutional activity historically coincided with bottom-formations or aggressive trend continuation phases.
During the recent recovery back to $0.198, large-scale transactions plummeted to just seven recorded transfers in a single tracking period. This precipitous drop in high-value network velocity reveals that institutional entities, high-net-worth individuals, and market makers are largely remaining on the sidelines. The current price advance appears primarily driven by retail liquidity and lower-tier spot accumulation, leaving the asset vulnerable to aggressive distribution should selling pressure re-emerge.
Market Dynamics & Expert Perspectives
Analyst Projections: The Path to $0.47
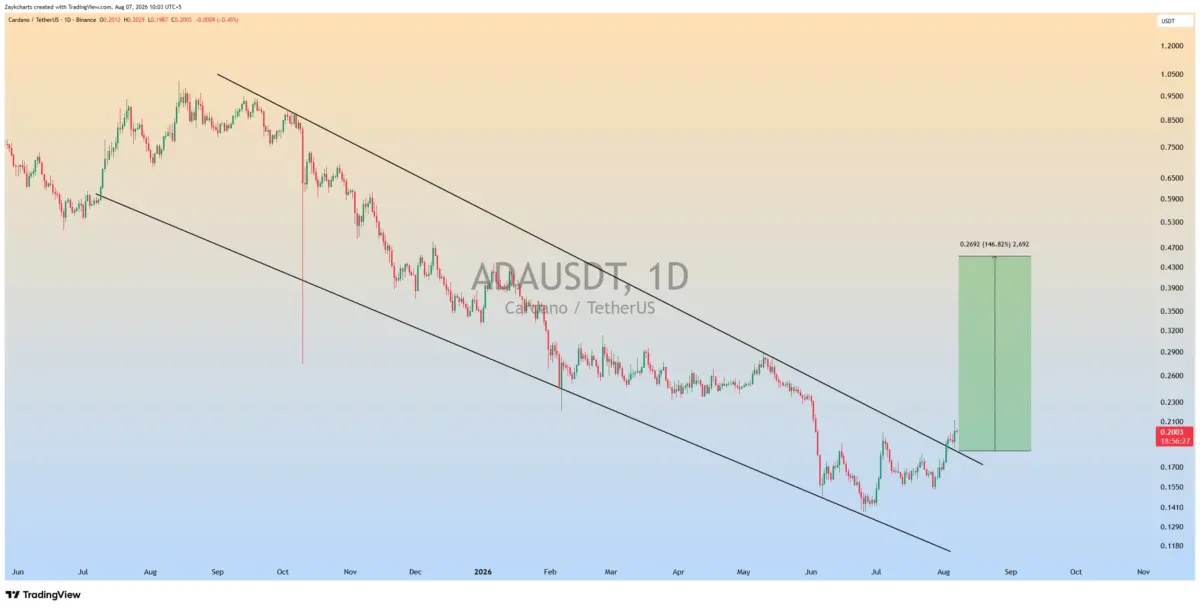
Cryptocurrency chartists and technical analysts point to the channel breakout as a primary catalyst for a larger structural expansion. According to market analyst ZAYK Charts, ADA’s exit from its multi-month downward-sloping channel confirms an accumulation phase transition.
Under this technical thesis, sustained consolidation above the $0.190–$0.200 breakout threshold validates a measured-move target near $0.47, representing an estimated 147% advance from current trading levels.
"Cardano has successfully cleared the upper boundary of its downward channel. The initial breakout move pushed prices higher by 13%, setting the groundwork for a broader recovery structure. Maintaining this breakout configuration opens a technical runway toward $0.47, provided spot demand absorbs overhead sell walls."
— ZAYK Charts, Crypto Technical Analyst
However, analysts caution that technical patterns do not operate in a vacuum. A failure to clear resistance at $0.220—or a invalidation drop back inside the channel—would neutralize the pattern, exposing ADA to retests of its lower June bounds.
Future Outlook & 2026 Forecast Scenarios
Looking ahead to 2026, market participants are evaluating three distinct macro scenarios for Cardano, balancing ecosystem growth against broad market liquidity and on-chain participation.
Mechanism: ADA consolidates steadily, driven by organic retail spot buying and ongoing protocol upgrades (such as Voltaire-era governance enhancements and scaling optimizations).
Outcome: Price clears immediate resistance at $0.200 but encounters overhead supply between $0.280 and $0.300. Yields modest returns ranging between 11% and 52% from present valuations, aligning with current baseline institutional estimates.
Scenario 2: Bullish Expansion ($0.47+)
Probability: Moderate
Mechanism: Broad market expansion, driven by Bitcoin structural tailwinds and altcoin liquidity rotation, triggers institutional re-entry. Large-scale whale transactions bounce back above historical thresholds of 50+ transfers per day, validating the channel breakout.
Outcome: ADA breaks decisively above $0.300, triggering buy-stops and momentum algorithms that propel the token toward the projected $0.47 target, delivering gains in excess of 147%.
Mechanism: Persistent institutional apathy and falling whale volume leave spot markets unable to absorb secondary distribution. A broader macro sell-off forces ADA back into its descending channel.
Outcome: The bullish setup invalidates, forcing a retest of lower support levels between $0.12 and $0.18, delaying long-term recovery timelines well into 2026.
Summary Assessment
Cardano’s short-term price action presents a classic market divergence. Technical structures point toward a meaningful breakout with upside potential targeting $0.30 and eventually $0.47. However, the lack of high-value whale activity highlights an underlying fragility in the rally.
For ADA to transition from a technical relief bounce to a sustained bull trend, market participants must look for a convergence of key factors: a decisive reclaim of the $0.200–$0.220 resistance range, a bullish cross on the MACD momentum indicator, and an immediate rebound in institutional whale transfers on-chain.