rifanmuazin is a reporter for DeBitcoin covering Crypto Market Analysis. She/He is based in Indonesia.
26 August 2026 • 8 min read
Solana (SOL) has staged a dramatic recovery, breaking through the critical $100 psychological resistance level following a 6.72% daily surge. This move culminates a broader 32% rally that began on August 19, driven by a convergence of unprecedented institutional inflows, record-setting Exchange-Traded Fund (ETF) trading volumes, and aggressive accumulation in the derivatives market.
Executive Overview
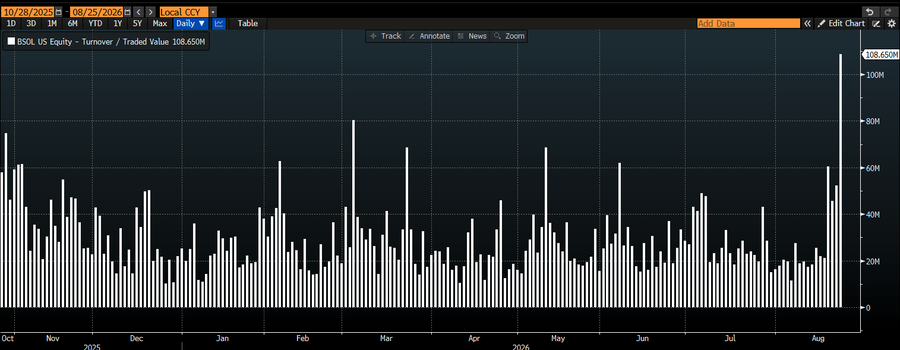
At the center of this revival is the Bitwise Solana Staking ETF (BSOL), which logged a single-day record trading volume of $108 million on August 24—the highest daily trading volume ever recorded for any Solana ETF product. Concurrently, aggregate institutional demand across all nine spot Solana ETFs trading in the United States reached a multi-month high, pushing total net assets held by these vehicles to $1.21 billion, a remarkable 68% expansion since June.
+-----------------------------------------------------------------------+
|                    SOLANA (SOL) MARKET SNAPSHOT                       |
+-----------------------------------------------------------------------+
| Spot Price                    | $100.00 (+6.72% 24h)                  |
| 7-Day Low-to-High Rally       | +32.00% (from August 19 low)          |
| Bitwise BSOL 24h Volume       | $108 Million (All-Time High)          |
| U.S. Spot SOL ETF Net Assets  | $1.21 Billion (+68% since June)       |
| Total Futures Open Interest   | $6.30 Billion (3-Month High)          |
| Solana Weekly DEX Volume      | $18.62 Billion (Highest since June)   |
+-----------------------------------------------------------------------+
The spot price surge is matched by sophisticated leverage activity. Market data reveals that crypto whales opened $36 million in new long positions on decentralized perpetual exchange Hyperliquid, while aggregate Solana futures Open Interest (OI) climbed to $6.30 billion—its highest reading since May. Underpinning this financial market activity is a substantial rise in network usage, with Solana’s weekly decentralized exchange (DEX) volume jumping to $18.62 billion, pointing to robust fundamental utility alongside speculative and institutional interest.
Detailed Chronology: The Path to $100
The momentum behind Solana’s push back into triple-digit territory developed over several distinct phases:
August 19                 August 24                 August 25
   |                         |                         |
   v                         v                         v
SOL bottoms out;         Bitwise BSOL posts        SOL breaches $100;
32% recovery rally       $108M trading volume;     Hyperliquid whales open
begins; Macro pivot      U.S. ETFs post $33.49M    $36M in long bets;
sparked by Treasury      single-day net inflows.   Open Interest hits $6.3B.
buyback news.
1. The Macro Pivot (August 19)
The groundwork for the rally was laid when broader risk asset markets responded positively to macro-liquidity signals, specifically policy announcements regarding U.S. Treasury buyback initiatives introduced by Treasury Secretary Scott Bessent. SOL found a local floor and initiated a steady upward trend, gaining momentum as spot buying absorbed overhead supply.
2. Institutional Volume Explosion (August 24)
Institutional engagement escalated dramatically over the weekend. On August 24, trading activity in the Bitwise Solana Staking ETF (BSOL) erupted to $108 million in daily volume. Data compiled by SoSoValue confirmed that BSOL captured $24.99 million in net daily inflows—its single best capital injection performance since February. Combined U.S. spot SOL ETF net inflows hit $33.49 million for the day, marking the highest single-day net tally across the industry since December.
3. Resistance Breach and Derivatives Surge (August 25)
Building on the institutional tailwinds from the previous day’s session, SOL advanced 6.72% to trade directly at $100. During the morning hours, derivatives markets showed intense capital deployment: high-net-worth address clusters (whales) established $36 million in leveraged long bets on Hyperliquid, while total network Open Interest expanded to multi-month highs.
Supporting Context & Market Metrics
Institutional ETF Flows and Asset Expansion
The surge in BSOL trading volume highlights an evolving landscape for crypto exchange-traded products, particularly those offering native staking yields. Institutional investors are increasingly seeking yield-generating asset structures rather than passive spot exposure alone.
U.S. SPOT SOLANA ETF METRICS
+----------------------------------+------------------+
| Metric                           | Value            |
+----------------------------------+------------------+
| BSOL Single-Day Record Volume    | $108.00 Million  |
| BSOL Net Daily Inflows (Aug 24)  | $24.99 Million   |
| Combined U.S. ETF Daily Inflows  | $33.49 Million   |
| Total ETF Net Assets (Current)   | $1.21 Billion    |
| Total ETF Net Assets (June)      | $717.00 Million  |
| Growth in Net Assets (3 Months)  | +68.76%          |
+----------------------------------+------------------+
Total net assets across all nine U.S.-listed spot Solana ETFs stood at $717 million in June. By August 25, that metric had climbed to $1.21 billion, representing a 68.76% gain in asset value under management (AUM) in roughly two months. This inflows dynamic demonstrates that institutional capital allocation has remained resilient despite mid-year price volatility.
On-Chain Fundamentals and Network Throughput
Financial market speculation is supported by elevated base-layer utility on the Solana blockchain. According to DeFiLlama data:
Weekly DEX Volume: Reached $18.62 billion, representing the highest weekly trading throughput on Solana decentralized exchanges since June.
Network Velocity: High DEX volumes relative to market capitalization indicate that liquidity remains deep, reducing slippage for large-scale swaps and driving organic demand for SOL as base transaction fees and rent fees.
SOLANA ON-CHAIN & DERIVATIVES METRICS
+----------------------------------+------------------+
| Metric                           | Value / Ratio    |
+----------------------------------+------------------+
| Weekly DEX Volume (DeFiLlama)    | $18.62 Billion   |
| Total Futures Open Interest      | $6.30 Billion    |
| Binance Long/Short Ratio         | 1.75             |
| OKX Long/Short Ratio             | 1.53             |
| Hyperliquid Whale Longs (Aug 25) | $36.00 Million   |
+----------------------------------+------------------+
Derivatives and Order Book Dynamics
Derivatives data from CoinGlass points to strong bullish positioning among top-tier traders and institutional market makers:
Open Interest (OI): Expanded to $6.30 billion, reaching a level last observed in May.
Exchange Long/Short Ratios: The long/short positioning ratio on Binance climbed to 1.75, while OKX registered 1.53, showing clear long bias across global crypto exchanges.
Hyperliquid Whale Activity: Institutional and high-net-worth traders executed $36 million in new net-long positions on the decentralized perpetual platform Hyperliquid on August 25 alone, accelerating the breach above $100.
Technical Analysis: Bull Flag Consolidation and Key Levels
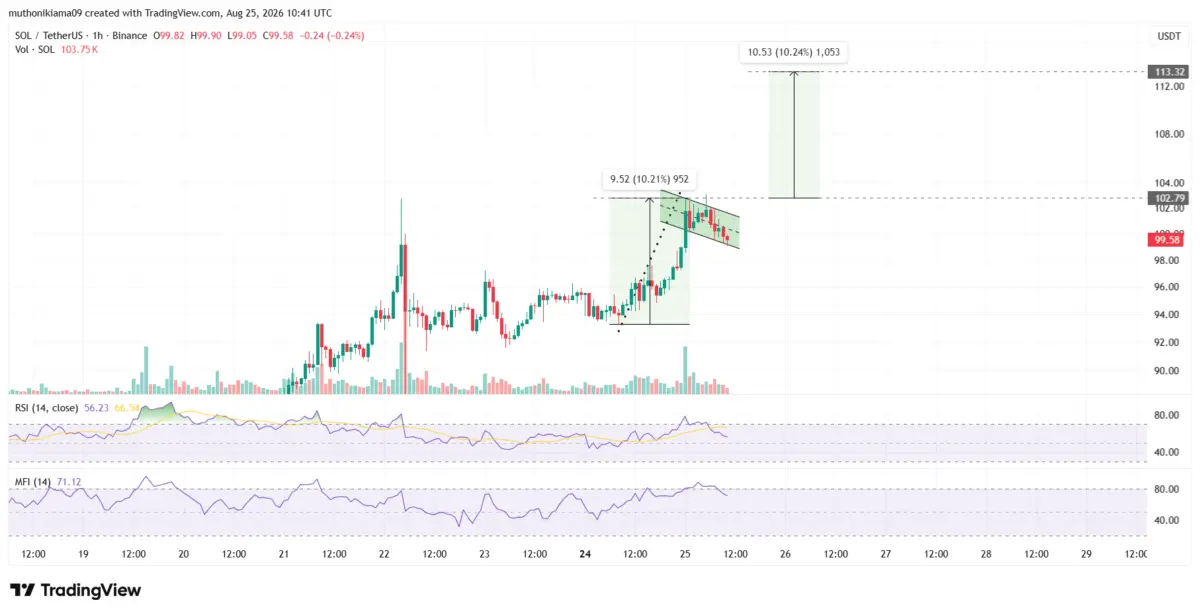
Solana’s price action over the lower timeframes displays a classical continuation geometry. Following its 32% upward leg off the August 19 lows, SOL entered a horizontal-to-descending consolidation channel on the one-hour (1H) chart, completing a textbook bull flag pattern.
SOL/USDT 1-Hour Chart Technical Setup
===================================================================
Price Target (Measured Move): $113.00
                                 ^
                                 |  +10% Breakout Expansion
Flag Resistance Level: -------- $102.00 ---------------------------
Current Spot Price:            $100.00
Flag Support Level: ----------- $99.00 ----------------------------
                                 |
                                 v  Pattern Invalidation
===================================================================
Technical Indicators:
- Relative Strength Index (RSI - 1H): 55 (Moderate Bullish Control)
- Money Flow Index (MFI - 1H):       71 (High Capital Inflow Pressure)
Key Technical Parameters:
The Flagpole & Height: The initial impulse move generated a flag height of approximately 10%.
Breakout Trigger ($102.00): A decisive hourly close above the flag’s upper resistance boundary at $102.00 confirms a technical breakout.
Upside Target ($113.00): Extrapolating the 10% pole height from the breakout point yields a measured price projection of $113.00.
Key Support & Invalidation ($99.00): SOL is actively testing the lower boundary support of the flag channel around $99.00. An hourly close beneath $99.00 would invalidate the immediate bull flag hypothesis, risking a retest of lower demand zones.
Momentum Oscillators:
Relative Strength Index (RSI): Sits at 55, placing momentum comfortably in bullish territory without being overbought, leaving room for further upside.
Money Flow Index (MFI): Registers at 71, indicating strong capital injection and continuous net accumulation during periods of price consolidation.
Official Statements & Institutional Commentary
Executive commentary from Bitwise Asset Management offers context on institutional capital behavior through volatile market cycles.
Responding to the milestone trading session, Teddy Fusaro, President of Bitwise, underscored the structural significance of the volume surge on social platform X:
"The Bitwise Solana Staking ETF (BSOL) pulled in $108 million in trading volumes on August 24, marking the highest single-day volume day for any Solana ETF in history."
Adding context to long-term investor behavior during market drawdowns, Hunter Horsley, Chief Executive Officer of Bitwise, highlighted how institutional capital systematically accumulated the product even when underlying spot prices faced significant corrections:
"The Bitwise Solana Staking ETF took in nearly $1 billion in inflows as price went from $225 to $60. Wonder what’s possible with price going in the other direction."
Horsley’s remarks highlight a core structural shift in digital asset markets: institutional capital vehicles like BSOL have functioned as counter-cyclical liquidity sponges, absorbing supply during macro downturns and tightening liquid float ahead of momentum shifts.
Future Outlook & Risk Analysis
Bullish Scenario: The Path to $113 and Beyond
If institutional inflows maintain their pace and spot buyers defend the $99 support, Solana remains well-positioned to break out past the $102 flag resistance.
Short-Term Target: A successful $102 breakout projects a technical move to $113.00.
Medium-Term Mechanics: Continued growth in U.S. ETF net assets (nearing $1.5 billion) combined with steady on-chain DEX velocity ($18B+ weekly) could catalyze systematic short squeezes across derivatives venues. Given that Open Interest stands at $6.30 billion with long/short ratios tilted heavily bullish, a breach above $105 could trigger cascaded buy-stops from remaining short positions.
Despite current bullish momentum, several structural risks could cap upside potential or trigger downside revisions:
Pattern Invalidation below $99: Should profit-taking push SOL below its flag support line at $99.00, the immediate bullish setup will be invalidated. This could trigger short-term liquidation of high-leverage positions, leading to a pull-back toward the $92.00–$94.00 liquidity pocket.
Derivatives Over-Leverage: With $36 million in fresh whale long positions concentrated on venues like Hyperliquid and Binance long/short ratios reaching elevated levels (1.75), the market faces localized downside exposure. Any sudden macro risk-off event could lead to long liquidations.
Macro Sensitivity: While expectations surrounding Treasury bond buybacks under Secretary Scott Bessent have boosted broader liquidity expectations, changes in federal interest rate projections or sudden shifts in broader financial markets could impact high-beta assets like Solana.
Summary
Solana’s return to $100 represents more than a psychological price milestone; it highlights a period where institutional product adoption and on-chain ecosystem usage are moving in lockstep. With ETF trading volumes setting historical records and whale traders deploying significant capital in perpetual markets, Solana’s near-term outlook hinges on defending $99 support to secure a path toward $113.