Executive Overview
On-chain data highlights an impending liquidity milestone in the institutional derivatives market: an estimated $5 billion worth of options contracts linked to BlackRock’s iShares Bitcoin Trust (IBIT) are scheduled to expire on September 18. This position skew—heavily weighted toward calls—underlines long-term institutional optimism, even as it exposes spot prices to short-term volatility as the expiration date approaches.
Simultaneously, micro-structural and macroeconomic metrics paint a dual picture. While asset manager inflows into spot products hit multi-month highs and portfolio managers pivot away from over-extended artificial intelligence equities, on-chain metrics reveal that veteran market participants capitalized on the approach to $80,000 to realize profits.
Traders and institutional desks now face a period of tactical consolidation. Technical indicators suggest that while the overarching bull market structure remains intact, Bitcoin risks a temporary retest of support near $75,000 before attempting another sustained push toward higher Fibonacci extension levels.
Detailed Chronology of the $80,000 Rejection
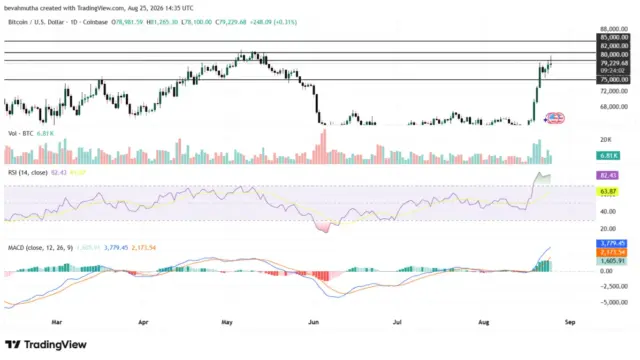
The attempt to breach $80,000 began with a strong push between August 20 and August 21, driven by spot ETF buying and favorable macro sentiment. This movement culminated on August 25, when spot prices briefly rallied toward the $80,000 resistance level.

[Aug 20–21] Rapid Spot Accumulation ──► [Aug 25] Push to $80,000 Resistance ──► [Aug 26] SOPR Spikes to 1.4 / Rejection to $78,707However, as Bitcoin touched the $80,000 threshold, dense order-book sell liquidity and accelerated profit-taking triggered a rejection. Spot prices were pushed lower over the subsequent 24 hours, settling around $78,707.
This rejection highlights a persistent supply overhang near key psychological levels. While institutional buyers through ETF channels actively absorb spot supply, long-term holders (LTHs) have used these rallies as liquidity windows to de-risk or rebalance portfolios.
Supporting Context & On-Chain Metrics
1. The Institutional Inflow Surge and Sector Rotation
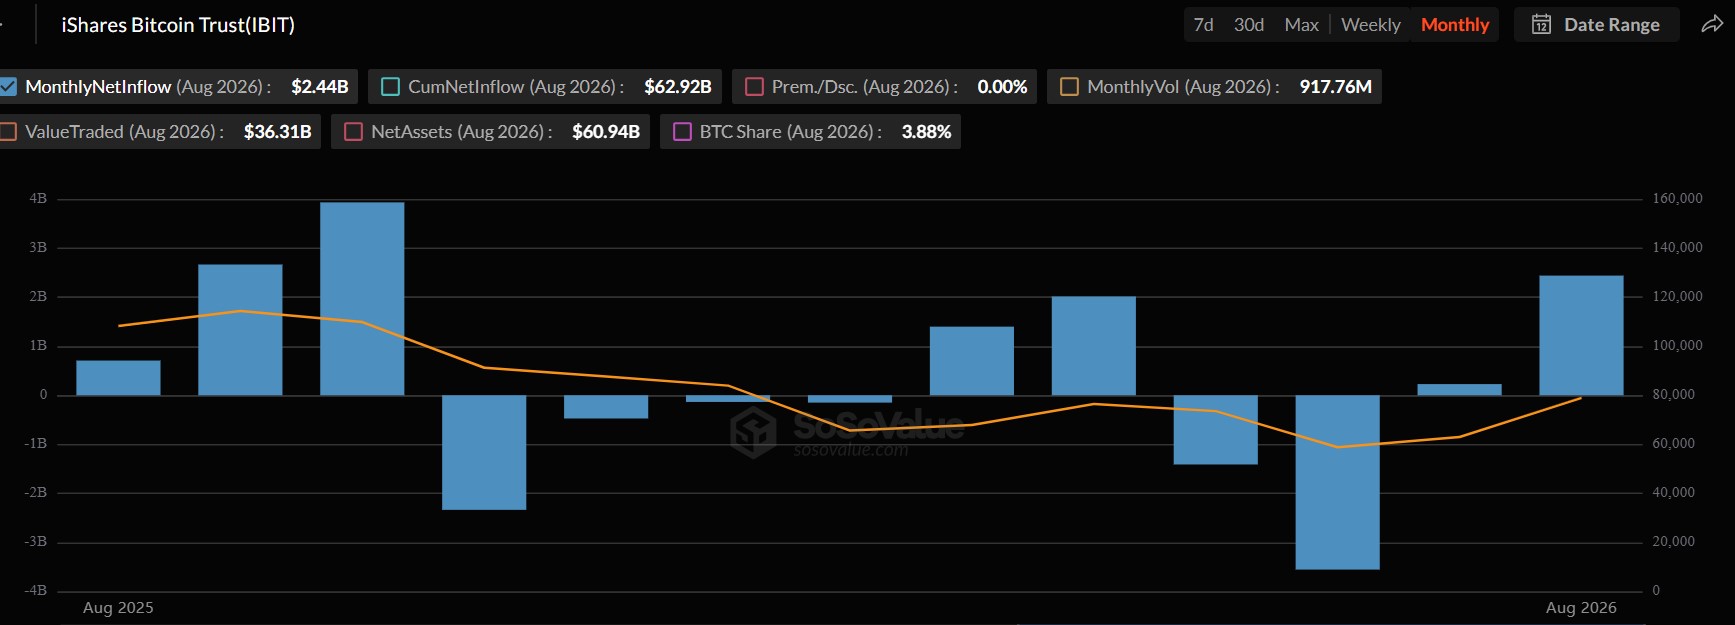
Despite the immediate price pull-back, spot ETF dynamics remain strong. According to data from SoSoValue, BlackRock’s iShares Bitcoin Trust (IBIT) recorded $2.44 billion in net inflows during August. This represents the highest monthly net inflow for the fund since October 2025, signaling persistent institutional demand.
IBIT Monthly Inflows (August Peak)
  $2.44 Billion ── Highest monthly inflow since October
Bloomberg ETF analyst Eric Balchunas noted that IBIT has climbed into the top ten most traded ETFs across global financial markets. This sustained volume stems in part from a broader sector rotation: market participants are increasingly trimming exposure to mega-cap artificial intelligence stocks, reallocating capital into digital assets.
This rotation is further supported by macroeconomic tailwinds. Expectations surrounding upcoming U.S. Treasury bond buybacks and broader fiscal recalibrations have exerted downward pressure on the U.S. Dollar Index (DXY), reinforcing Bitcoin’s appeal as a sovereign hedge and monetary alternative.
        ┌────────────────────────────────────────┐
        │        Macro & Allocation Shift        │
        └───────────────────┬────────────────────┘
                            │
            ┌───────────────┴───────────────┐
            ▼                               ▼
  AI Equity Exposure            U.S. Dollar Index (DXY)
     [Trimming]                      [Softening]
            │                               │
            └───────────────┬───────────────┘
                            ▼
               Spot Bitcoin Accumulation
            (IBIT: $2.44B Net Aug Inflows)
2. Spent Output Profit Ratio (SOPR) Signals LTH Profit-Taking
While institutional ETF vehicles act as steady accumulation channels, on-chain data from CryptoQuant reveals why the $80,000 barrier proved insurmountable in the short term.
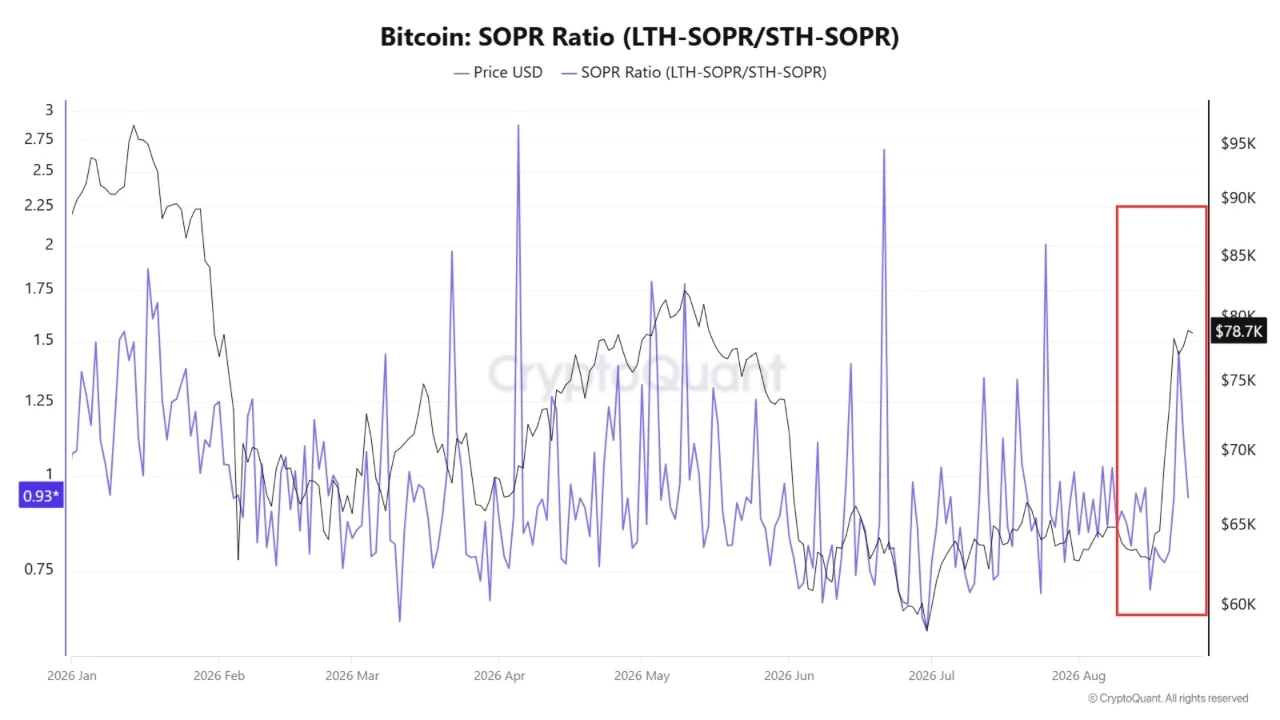
The Spent Output Profit Ratio (SOPR)—a metric measuring the aggregate profit margin of moved coins—surged to 1.4 as spot prices approached $80,000. An SOPR reading significantly above 1.0 indicates that spent coins were moved at a substantial profit.
CryptoQuant SOPR Metric
  1.4 Level Reached near $80,000 Resistance
  └─ Indicator of heavy profit-taking by Long-Term Holders (LTHs)
CryptoQuant analyst XWIN Japan highlighted that this spike was primarily driven by long-term holders selling at higher profit margins than short-term holders. This LTH distribution met incoming spot ETF demand, capping upward momentum and creating the overhead supply that forced prices lower.
Derivatives Dynamics: The $5 Billion IBIT September Options Expiry
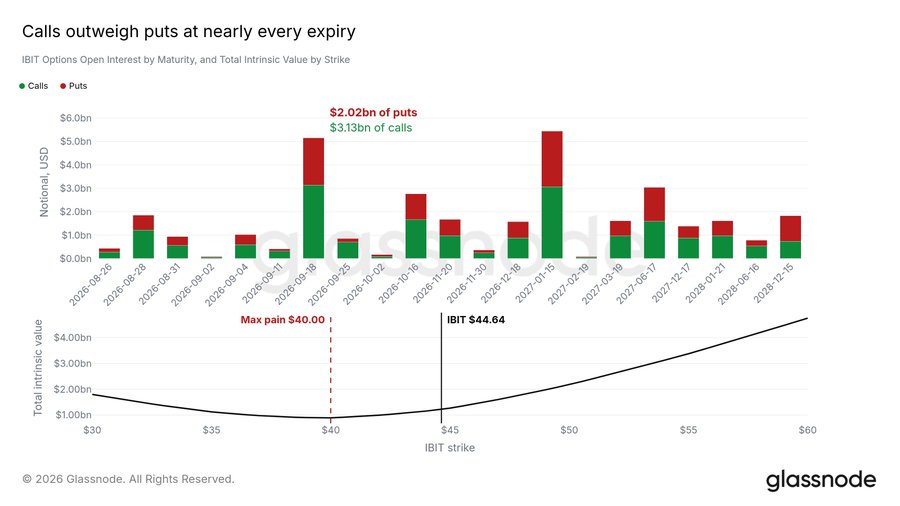
A key catalyst for prospective September price action lies within the options market. Data compiled by Glassnode indicates that $5 billion in open interest across IBIT options contracts will expire on September 18.
IBIT September 18 Options Open Interest Breakdown:
┌──────────────────────────────────────────────────────────┐
│  Call Options (Bullish): $3.0 Billion                     │
├──────────────────────────────────────────────────────────┤
│  Put Options (Bearish):  $2.0 Billion                     │
└──────────────────────────────────────────────────────────┘
Key Parameters of the Impending Expiry:
- Call Open Interest: $3 billion
- Put Open Interest: $2 billion
- Put/Call Ratio: ~0.67 (reflecting institutional call bias)
- Max Pain Strike: $40 per IBIT share (equivalent to ~$71,000 spot BTC)
IBIT Strike vs. BTC Equivalent
  $40 IBIT Share Strike ──► ~$71,000 Spot BTC Equivalent
The heavy concentration of call options demonstrates long-term structural bullishness among institutional options traders. However, in the immediate term, this positioning creates market mechanics that can amplify volatility:
- Dealer Gamma Hedging: Market makers who sold call options typically hedge their exposure by buying spot BTC or futures as prices rise, and selling as prices drop. If spot prices fall toward the "max pain" point, automated delta-hedging by market makers can accelerate downward pressure.
- Max Pain Pinning Effects: The $40 Max Pain strike for IBIT ($71,000 BTC equivalent) represents the price point at which the maximum number of options contracts expire worthless. As September 18 approaches, option pinning mechanics may drag spot prices down toward this level if buying momentum weakens.
Technical Analysis & Chart Configurations
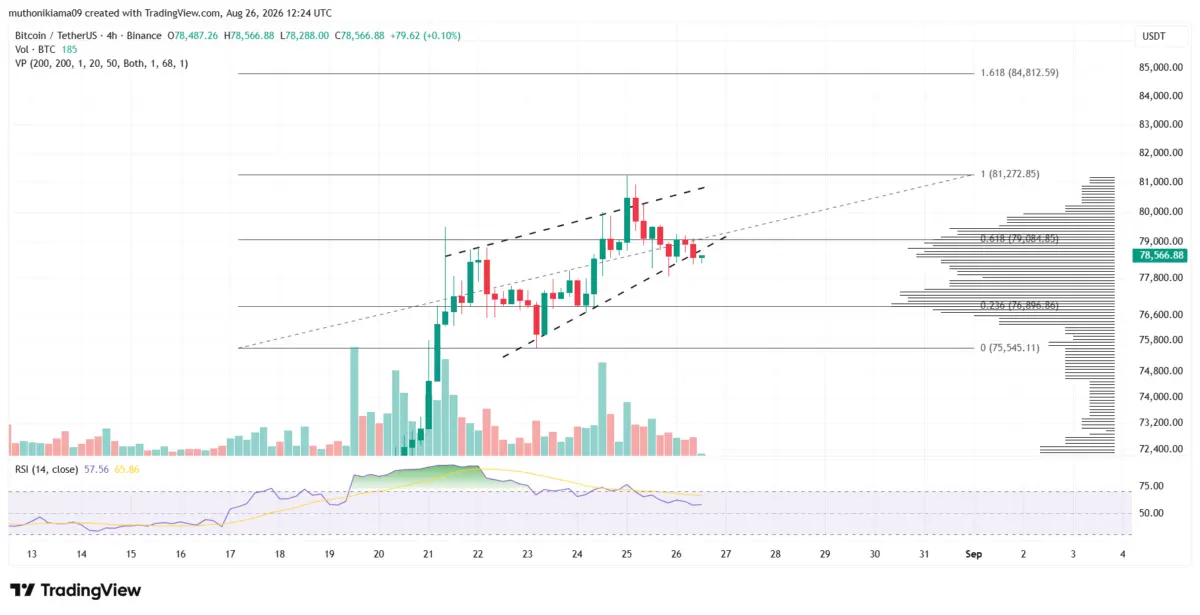
A review of the four-hour (4H) BTC/USDT chart highlights clear short-term technical boundaries and structural patterns guiding current market behavior.
BTC/USDT 4-Hour Technical Structure:
===========================================================
  [Target]          $90,000    Major Resistance Level
                       │
  [Fib 161.8%]     $84,800    Upside Extension Target
                       │
  [Psych Barrier]  $80,000    Current Resistance Zone
                       │
  [Current Price]  $78,707    Consolidation Zone
                       │
  [Breakout Trigger]$78,300   Rising Wedge Lower Boundary
                       │
  [Pattern Target]  $75,545   3.75% Wedge Height Projection
                       │
  [Macro Support]   $75,000    Key Support Floor
===========================================================
1. The 4-Hour Rising Wedge
Price action on the four-hour chart has consolidated within a rising wedge pattern. Rising wedges typically represent exhaustive upward structures that often resolve down when lower support lines break.
- Pattern Height: 3.75%
- Critical Wedge Support: $78,300
- Calculated Downside Target: $75,545
If Bitcoin breaks below the $78,300 support line, the pattern projects a drop toward $75,545, near the $75,000 major psychological support floor.
2. Relative Strength Index (RSI) & Macro Indicators
Despite the short-term wedge pattern, broader indicators suggest the market is re-establishing structural support rather than entering a extended bear trend:
- Relative Strength Index (RSI): The 4-hour RSI sits at 57. Positioned above the neutral 50 mid-line, it indicates that bullish momentum persists, remaining outside overbought territory (>70).
- Bull-Bear Market Cycle Indicator: On-chain macro tracking indicates the prior bear phase has concluded. The pullback from $80,000 to $78,707 appears to be a healthy cooling-off period following the rapid liquidity expansion seen in mid-August.
3. Upside Projection Targets
For the bullish trend to resume, Bitcoin must secure a daily close above the $80,000 resistance level. A confirmed breakout past $80,000 would clear the overhead supply, opening technical paths toward:
- 161.8% Fibonacci Extension: $84,800
- Macro Objective: $90,000
Strategic Outlook & Institutional Forecasts
Market projections reflect a divergence between short-term tactical risks and multi-year structural potential:
Timeline Scenarios
┌────────────────────────────────────────────────────────┐
│ Short-Term (Sept 2026): Retest $75,000 - $75,500 zone  │
├────────────────────────────────────────────────────────┤
│ Medium-Term (Mid-2027): $150,000 (Bernstein Target)    │
├────────────────────────────────────────────────────────┤
│ Long-Term (By 2029):    $300,000 (Bernstein Target)    │
└────────────────────────────────────────────────────────┘
In the near term, the convergence of the $5 billion IBIT options expiry on September 18, persistent LTH profit-taking around SOPR 1.4, and the 4-hour rising wedge structure suggests Bitcoin could retest $75,000 support. Such a pullback would allow order books to clear excess leverage and establish a solid base for the next advance.
From a long-term perspective, analysts view these periodic pullbacks as natural consolidations within a broader structural bull market. Research analysts at Bernstein maintain a constructive outlook, forecasting that Bitcoin could reach $150,000 by mid-2027, driven by institutional ETF adoption, expanding treasury reserve models, and favorable macroeconomic conditions, before trending toward $300,000 by 2029.
Whether Bitcoin drops to test $75,000 or breaks directly above $80,000, institutional ETF accumulation alongside evolving derivatives markets signals that digital assets are becoming increasingly integrated into global portfolio management.