Executive Overview
The parabolic ascent was catalyzed by a confluence of institutional tailwinds, including a massive surge in U.S. spot Bitcoin Exchange-Traded Fund (ETF) inflows led by BlackRock, shifting global macroeconomic expectations, and a pronounced squeeze in derivatives positioning. Over an eight-day window, Bitcoin gained approximately 28% from its structural double-bottom around the $62,000 support floor, expanding its total market capitalization by nearly $350 billion.
+-----------------------------------------------------------------------+
|                         BITCOIN RALLY SUMMARY                         |
+------------------------------------+----------------------------------+
| Peak Price Attained                | $81,265 (15-Week High)           |
| 8-Day Price Gain                   | ~28% (From $62,000 lows)         |
| Market Cap Expansion               | +$350 Billion                    |
| Single-Day Spot BTC ETF Inflows    | $338 Million (Led by BlackRock)  |
| Key Support Zones                  | $78,000 / $75,000 / $72,000      |
| Key Resistance Targets             | $80,000 / $82,000 / $85,000      |
+------------------------------------+----------------------------------+
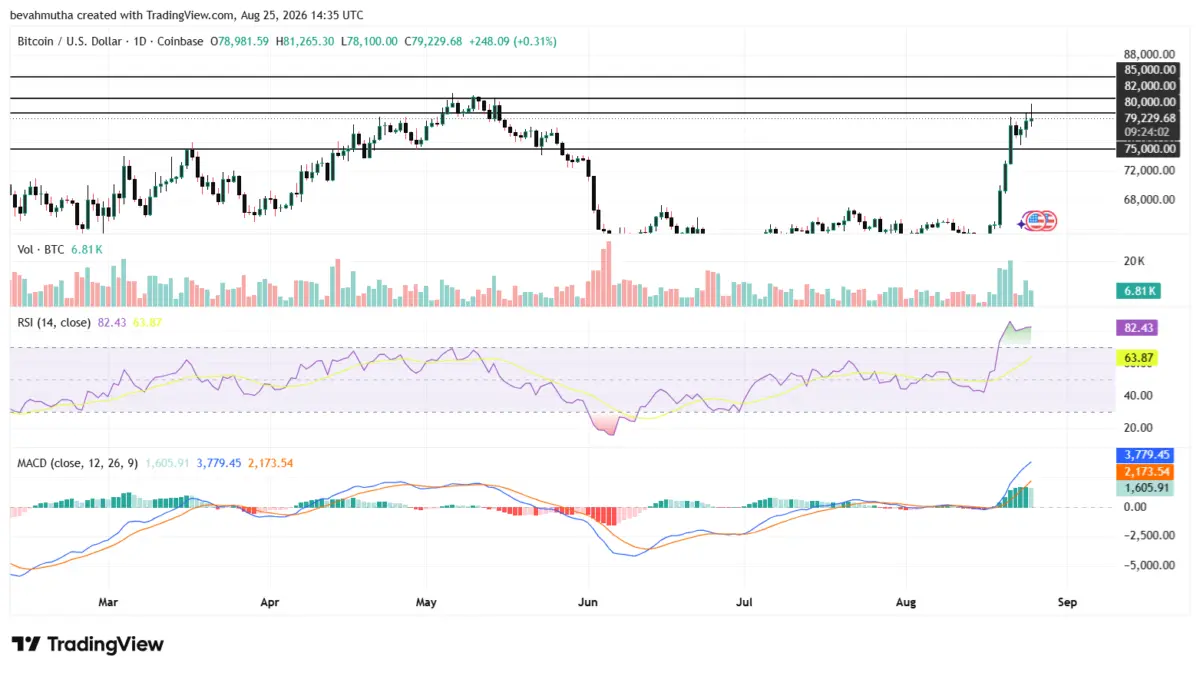
Although rapid profit-taking subsequently dragged spot prices briefly back beneath $80,000 to settle near $78,254—representing a minor intraday pullback of 0.92%—the broader structural breakout remains intact. The rally has reinvigorated market sentiment across the broader digital asset ecosystem, pulling major altcoins like Ethereum and XRP out of multi-week consolidation ranges. However, momentum metrics such as the daily Relative Strength Index (RSI) reaching 78.71 suggest that the asset is entering an overbought regime, prompting Wall Street analysts and crypto strategists to debate whether a brief consolidation will precede an push toward the $85,000 mark.
Detailed Chronology: Anatomy of an 8-Day Breakout
The journey to $81,265 represents a sharp reversal from the risk-off environment that dominated digital asset markets throughout mid-summer. Understanding the trajectory requires examining the four distinct phases of the multi-day surge:
[Phase 1: $62K Base] ---> [Phase 2: Range Breakout] ---> [Phase 3: $81.2K High] ---> [Phase 4: $78.2K Consolidation]
  Double-bottom test        Breaching $77K-$78K band        Parabolic short squeeze      Profit-taking pullback
Phase 1: The $62,000 Double-Bottom Foundation
Prior to the current expansion, Bitcoin experienced intense sell pressure that repeatedly pushed prices down toward the $62,000 demand zone. On two separate occasions over the preceding fortnight, bear pressure attempted to break beneath this critical macro band. Institutional order-book depth held firm, absorbing the liquidation volume and establishing a formidable double-bottom base. This defense laid the structural groundwork for the subsequent impulse move.
Phase 2: Penetration of the $77,000–$78,000 Consolidation Band
As buying volume began to materialize, Bitcoin initiated an upward drive that dismantled several key overhead technical resistance levels. Between $77,000 and $78,000, BTC had spent weeks locked in tight consolidation characterized by low volatility and contracting liquidity. Once buyers reclaimed $78,000 with expanding daily volume, systematic momentum algorithms and breakout traders stepped in, accelerating the price action.
Phase 3: The Parabolic Surge to $81,265
By Tuesday morning, mounting spot buying pressure combined with forced liquidations of short derivatives positions propelled Bitcoin across the $80,000 threshold for the first time in nearly 15 weeks. The asset touched a session peak of $81,265, generating one of the largest single-week market cap expansions in the past five years. In total, the digital asset added approximately $350 billion to its valuation in eight days, completely erasing three months of multi-point price decay.
Phase 4: Profit-Taking and Intraday Retrenchment
Upon reaching $81,265, immediate sell orders hit order books as short-term market participants and high-frequency funds locked in profits. The sudden influx of sell liquidity pulled spot prices down below $80,000, establishing a session low around $78,254. Despite this 0.92% daily step-back, Bitcoin managed to retain the vast majority of its 8-day advance, consolidating above its former resistance-turned-support zone.
Supporting Context & Metrics: Institutional Inflows & Macro Drivers
The rally above $81,000 was not merely a retail-driven speculative event; it was heavily underpinned by persistent, scale-based institutional buying across capital market channels.
U.S. SPOT ETF NET DAILY INFLOWS (AUG 24)
========================================================================
Spot Bitcoin ETFs : $338.00 Million
  └── BlackRock (IBIT) Contribution : $209.00 Million (61.8%)
------------------------------------------------------------------------
Spot Ether ETFs   : $116.00 Million
  └── BlackRock (ETHA) Contribution : $90.92 Million (78.4%)
========================================================================
Institutional Capital Flows via Spot ETFs
Data recorded on August 24 highlights a notable surge in demand through regulated U.S. vehicle channels:
- Spot Bitcoin ETFs: Registered a net daily inflow of $338 million. The influx was anchored by BlackRock’s iShares Bitcoin Trust (IBIT), which captured $209 million in fresh capital allocation during a single session.
- Spot Ether ETFs: Attracted $116 million in net daily inflows, led overwhelmingly by BlackRock’s ETHA instrument, which absorbed $90.92 million.
This heavy tilt toward BlackRock products demonstrates that institutional asset managers are actively re-engaging with crypto exposure following weeks of sideline observation.
Market Capitalization and Derivative Mechanics
The velocity of Bitcoin’s movement was amplified by leverage dynamics across derivatives exchanges. As spot buying pushed prices beyond the multi-week consolidation high of $78,000, high-leverage short positions were systematically liquidated. This short squeeze created an order vacuum, allowing spot market bids to lift the asset rapidly past $81,000. While overall macroeconomic capital flows into risk assets remain relatively tight on a multi-quarter view, the tactical concentration of capital into Bitcoin demonstrated exceptional relative strength.

+-----------------------------------------------------------------------+
|                    ALTCOIN MARKET BEHAVIOR & FLOWS                    |
+-------------------+---------------------------------------------------+
| Asset             | Price Action & Correlation                        |
+-------------------+---------------------------------------------------+
| Ethereum (ETH)    | Held steady near $2,500; supported by $116M ETF   |
|                   | inflows.                                          |
| XRP               | Rebound from $0.99 support amidst heightened      |
|                   | network activity.                                 |
+-------------------+---------------------------------------------------+
Broad-Market Spillover
The optimism surrounding Bitcoin triggered modest upside across major altcoins:
- Ethereum (ETH): Traded defensively near the $2,500 psychological barrier, buttressed by its own positive ETF net flows.
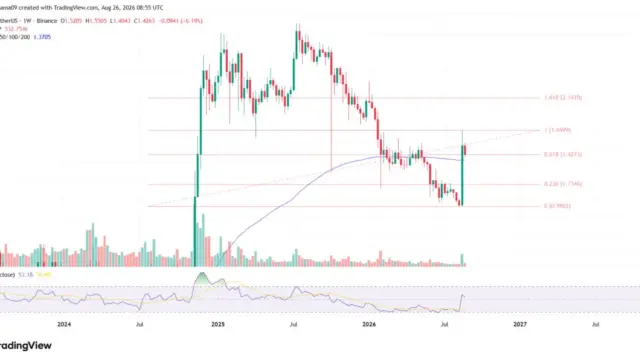
- XRP: Staged a recovery from the $0.99 key support level, propelled by a surge in underlying chain activity and market-wide sentiment stabilization.
Official Statements & Market Commentary
Market analysts and institutional tracking desks noted that the sudden surge represents a structural sentiment shift, albeit one accompanied by tactical risks.
Prominent market intelligence desk Bull Theory highlighted the scale of the expansion via an analytical update:
"BREAKING: Bitcoin hits $80,000 for the first time in almost 15 weeks. It is now up 28% in the last 8 days adding $350 BILLION to its marketcap. $BTC has now wiped out 3 months of losses in just 1 week."
The update underscored the speed with which institutional sentiment transitioned from caution to aggressive accumulation, framing the weekly performance as one of the most decisive upside pushes in recent digital asset history.
Similarly, financial data tracking outlet Wu Blockchain detailed the role of institutional vehicles in sustaining the upward momentum:
"BlackRock Leads $338 Million Bitcoin ETF Inflow as Ether Funds Add $116 Million. U.S. spot Bitcoin ETFs recorded $338 million in net inflows on Aug. 24, led by BlackRock’s IBIT with $209 million, while spot Ether ETFs attracted $116 million, with BlackRock’s ETHA accounting for [the vast majority]…"
Financial commentary surrounding the move emphasizes that while institutional appetite via spot ETFs is robust, the presence of heightened derivative leverage suggests short-term tactical volatility remains high. Market participants are watching whether macro liquidity will continuously support these higher valuations or if price action will drift back into range-bound trading.
Technical Analysis & Future Outlook
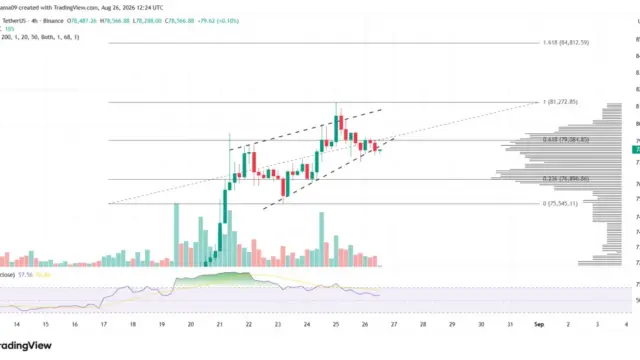
From a technical perspective, Bitcoin’s thrust above $81,000 has radically altered the higher-timeframe chart architecture, though immediate indicators flash warnings of short-term exhaustion.
                       [ $85,000 - Major Bullish Target ]
                                      ^
                                      |
                       [ $82,000 - Secondary Resistance ]
                                      ^
                                      |
                       [ $80,000 / $81,265 - Immediate Pivot Zone ]
========================================================================
                       [ $78,000 - Local Support / Consolidation ]
                                      |
                                      v
                       [ $75,000 - Key Technical Support Floor ]
                                      |
                                      v
                       [ $72,000 - Invalidations & Trend Baseline ]
Key Technical Indicators
- Relative Strength Index (RSI): The 14-day RSI surged to 78.71 following the 8-day sprint. An RSI reading above 70 firmly places the asset in overbought territory, historically signaling that an asset is due for a temporary pause, pullback, or sideways consolidation phase as buyers digest gains.
- Moving Average Convergence Divergence (MACD): The MACD histogram continues to print expanding green momentum bars, with the MACD line maintaining a wide, bullish separation above the signal line. This confirms that the underlying macro trend vector remains upward.
Strategic Price Levels to Watch
Resistance Targets
- $80,000 – $81,265 Zone: The immediate overhead resistance. A sustained daily close above the $81,265 wick high is required to confirm structural trend continuation.
- $82,000: A secondary psychological resistance level where previous liquidation clusters reside.
- $85,000: The primary macro upside target eyed by bullish chartists. A clean breakout above $82,000 opens a clear path toward this boundary.
Support Floors
- $77,000 – $78,000 Range: The immediate consolidation base. Reclaiming and holding this range on pullbacks preserves the short-term bullish momentum.
- $75,000 Floor: The critical near-term structural line in the sand. A drop below $75,000 would signal a breakdown of the immediate momentum structure and invite deeper corrective action.
- $72,000 Base: The major trend invalidation level. Losing $72,000 would completely neutralize the bullish posture built during this 28% advance.
Market Scenarios: What Lies Ahead?
The Bullish Continuation Scenario
If institutional ETF inflows persist at or above the $300 million daily threshold, spot absorption could swiftly clear the supply overhead between $80,000 and $81,265. Under this scenario, a brief period of sideways consolidation near $79,000 would allow the overbought RSI (78.71) to cool off toward the 60 neutral region without compromising price structure. A subsequent leg higher would target $82,000, setting up a retest of $85,000 before the end of the quarter.
The Corrective Pullback Scenario
Should short-term traders accelerate profit-taking while spot ETF demand cools, Bitcoin could undergo a deeper mean-reversion move. A breakdown below $78,000 would likely push prices toward the key $75,000 support level. Provided $75,000 holds, such a pullback would represent a classic macro higher-low print, offering sidelined institutional capital a re-entry opportunity before a secondary attempt at the $85,000 mark. However, a failure to hold $75,000 would expose $72,000 and signal that the recent move was a tactical liquidity sweep rather than a sustained bull market expansion.