Executive Overview
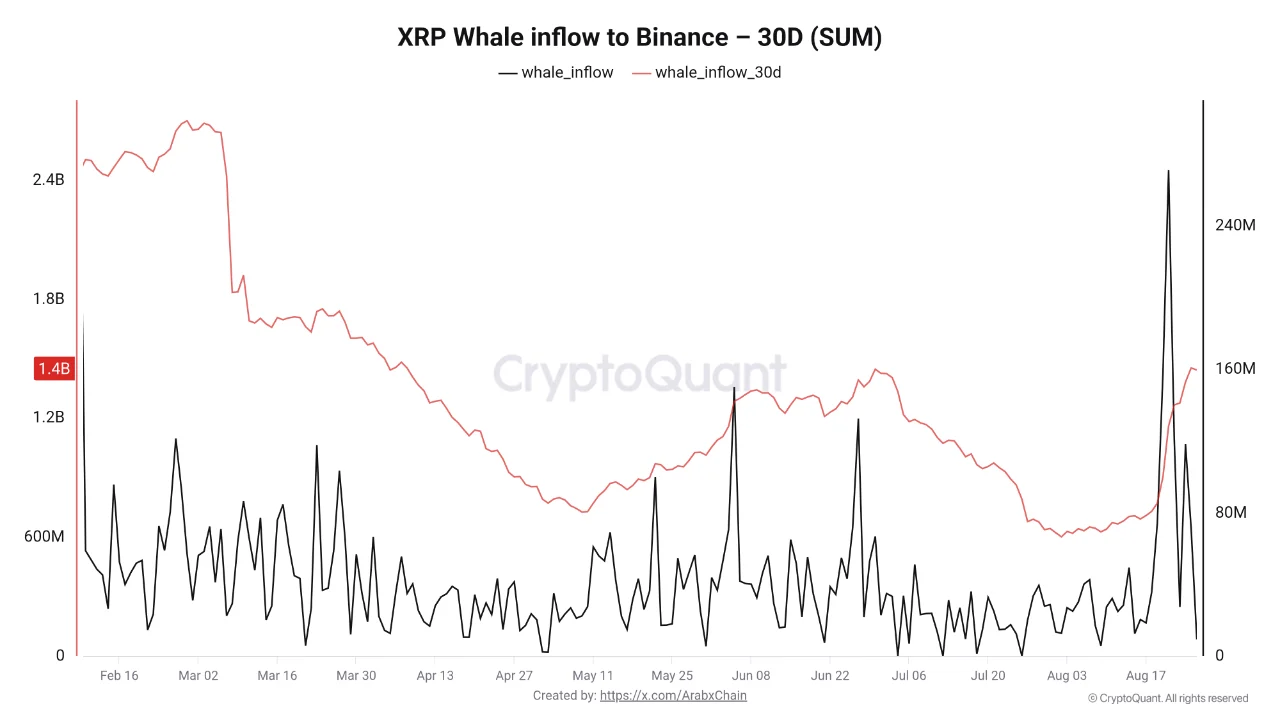
Despite this short-term spot market weakness, beneath the surface lies a complex narrative marked by heavy institutional participation and significant on-chain activity. A thorough examination of blockchain analytics reveals a sharp spike in whale transfers to Binance, reaching a four-month peak. Simultaneously, institutional demand via exchange-traded funds (ETFs) has reached multi-month highs, spearheaded by high-profile financial institutions accumulating substantial positions.
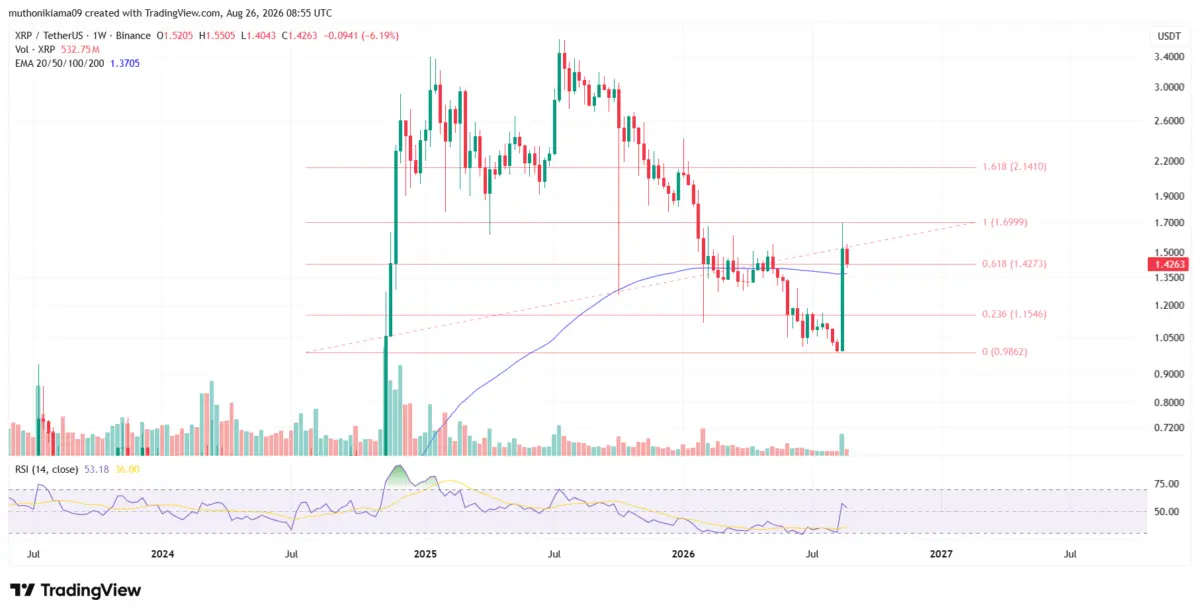
As XRP trades near the pivotal 200-week Exponential Moving Average (EMA) at $1.37, market participants are weighing conflicting signals: potential spot selling pressure from high-net-worth holders against continuous institutional absorption. This report provides an exhaustive investigation into the catalysts, on-chain metrics, institutional flows, and technical scenarios framing XRP’s current market structure.
Detailed Chronology of the XRP Volatility Cycle
To understand the current price consolidation at $1.43, it is essential to trace the macro sequence of events that unfolded throughout the summer trading period.
+-----------------------------------------------------------------------------------+
|                            CHRONOLOGY OF EVENTS                                  |
+-----------------------------------------------------------------------------------+
|  July – Early Aug  | Whales remain subdued; trading volume consolidates around $1.00. |
|  August 18         | ETF accumulation streak begins; network address growth starts.    |
|  Mid-August        | Whale Binance inflows hit 4-month high; XRPL activity spikes.     |
|  August 22         | Bullish momentum drives XRP price from $1.00 to a peak of $1.69. |
|  August 25         | Daily ETF inflows hit $23.87M; total crypto ETF inflows $559M.   |
|  August 26         | Market-wide retreat pulls XRP down 4.3% to $1.43 (200-wk EMA test)|
+-----------------------------------------------------------------------------------+
Phase 1: Dormancy and Base Building (July – Early August)
Throughout July and the early weeks of August, XRP price action was characterized by low volatility and range-bound trading around the psychological $1.00 mark. On-chain metrics showed reduced whale velocity, with large account addresses maintaining static balance sheets. During this period, net exchange flows remained neutral, signaling a lack of immediate direction from major market participants.
Phase 2: On-Chain Resurgence and Whale Mobilization (Mid-August)
By mid-August, on-chain monitoring platforms detected a structural shift in network velocity. Large-scale token holders—colloquially known as "whales"—ended their multi-week period of inactivity. Blockchain ledgers registered a massive migration of tokens into exchange wallets, particularly onto Binance. This sudden wave of liquidity coincided with an explosive surge in active addresses on the XRP Ledger (XRPL), signaling that both retail and institutional participation were ramping up simultaneously.

Phase 3: The Mid-August Breakout (August 18–22)
Fueled by expanding network participation and steady institutional buying, XRP broke out of its accumulation structure on August 18. Over a four-day rally, the digital asset surged by nearly 69%, rising from $1.00 to an intraday high of $1.69 on August 22. This upward impulse temporarily decoupled XRP from the broader crypto market, driven by heavy spot purchases and derivative positioning.
Phase 4: Market-Wide Retrenchment (August 25–26)
Following the peak at $1.69, profit-taking emerged across major exchanges. The correction deepened as macro headwinds impacted the broader digital asset ecosystem, leading to synchronous declines in Bitcoin and Ethereum. By August 26, XRP drifted down by 4.3% to trade at $1.43, bringing the token within range of testing its long-term weekly moving averages.
Supporting Context & On-Chain Metrics
A rigorous analysis of XRP’s fundamental market position requires examining three interconnected pillars: native ledger metrics, exchange flow dynamics, and regulated institutional investment vehicles.
+-----------------------------------------------------------------------------------+
|                        KEY ON-CHAIN & FINANCIAL METRICS                           |
+-----------------------------------------------------------------------------------+
| Metric                             | Value / Observation                          |
+------------------------------------+----------------------------------------------+
| Current Spot Price                 | $1.43 (-4.3% 24h drop)                       |
| Crucial Support Level              | 200-Week EMA ($1.37)                         |
| Upside Target (161.8% Fib)         | $2.14                                        |
| Downside Target (23.6% Fib)        | $1.15                                        |
| Relative Strength Index (RSI)      | 53.0 (Neutral-Bullish)                       |
| XRPL Active Addresses Growth       | +654% (47,180 -> 356,070)                    |
| Single-Day ETF Net Inflow (Aug 25) | $23.87 Million (3-month high)                |
| Total Crypto ETF Inflows (Aug 25)  | $559 Million                                 |
| Major Institutional Exposure       | Goldman Sachs ($86 Million ETF Holding)      |
+------------------------------------+----------------------------------------------+
Network Activity and Ledger Fundamentals
Network utility often acts as a leading indicator for token valuation. Data tracking the XRP Ledger shows an extraordinary expansion in user engagement during the late August cycle.
- Active Address Expansion: Active addresses on the XRPL skyrocketed by 654%, expanding from a baseline of 47,180 unique daily addresses to 356,070.
- Transaction Density: The growth in active addresses was accompanied by a corresponding spike in payment transactions and trust-line creations. This structural increase in ledger utilization suggests that the price move from $1.00 to $1.69 was underpinned by real transactional demand, rather than speculative leverage alone.
Whale Inflow Dynamics to Exchange Reserves
Data compiled by CryptoQuant highlights a significant movement of tokens from self-custody wallets onto centralized trading venues. Over a 30-day window, whales deposited vast tranches of XRP to Binance, bringing exchange-bound token volumes to their highest levels in four months.
       WHALE EXCHANGE INFLOWS vs. SPOT PRICE ACTION

  Volume / Price
    ^
    |                                   * Peak ($1.69)
    |                                 *
    |                               *        Current ($1.43)
    |                             *         *
    |         Whale Inflow      *               [200-Wk EMA Support: $1.37]
    |           Spike         *                *---------------------------
    |             |         *
    |          +-----+    *
    |          |     |  *
    ----+------|-----|*--------------------------------------------------> Time
       July   Mid-Aug                       Aug 26
Historically, sizable exchange deposits were interpreted as an imminent sell signal. However, modern market structures present alternative explanations for large-scale transfers:
- Derivatives Collateralization: Institutional entities frequently deposit spot assets to serve as margin collateral for options writing or futures hedging strategies.
- OTC and Arbitrage Distribution: High-volume desks transfer tokens to deep liquidity pools like Binance to facilitate over-the-counter (OTC) settlements or capture cross-venue yield spreads.
- Portfolio Rebalancing: Asset managers adjusting their risk profiles during heightened volatility often shift capital to high-liquidity order books without executing immediate market-sell orders.
Institutional Inflows and ETF Accumulation
While spot exchanges registered increased token inflows, regulated institutional investment channels saw persistent capital accumulation.
- Single-Day Milestone: On August 25, spot XRP ETFs logged $23.87 million in net inflows. This marked the single highest daily capital allocation into XRP-backed exchange funds since May.
- Inflow Streak: August 25 marked the sixth consecutive day of net positive inflows into XRP investment funds, starting from August 18.
- Broader ETF Landscape: This institutional appetite for XRP mirrors broader crypto asset allocations, which saw aggregate digital asset fund inflows surge to $559 million on August 25 alone.
- Institutional Class Exposure: Balance sheet disclosures show that global financial institutions are establishing substantial equity-backed exposures to the token. Notably, investment bank Goldman Sachs emerged as a leading institutional holder of XRP ETFs, maintaining a position valued at approximately $86 million.
Official Statements & Market Perspectives
Market experts and technical researchers caution against interpreting whale transfers through a purely bearish lens.
CryptoQuant Analytics Insights
In a detailed market commentary, CryptoQuant analyst Arab Chain highlighted that the mid-August whale activity directly preceded the rapid price ascension from $1.00 to $1.69:
"Whales remained relatively muted between July and early August, but exchange inflows accelerated markedly by mid-month. However, these inflows do not inherently mean that large holders are preparing to liquidate their positions. Whales frequently move XRP to major trading venues for liquidity management, complex portfolio reallocation, OTC execution, or to position themselves strategically ahead of anticipated market moves."
Institutional Desk Sentiment
Institutional strategy desks note that the structural divergence between spot retail selling and fund inflows highlights a changing owner demographic. While shorter-term holders take profits during market pullbacks, institutional investors are using spot dips to build long-term exposures through regulated products. The presence of Tier-1 investment institutions like Goldman Sachs signals growing institutional comfort with XRP’s underlying compliance framework and utility profile.
Technical Analysis & Future Outlook
From a technical chart perspective, XRP sits at a critical technical juncture. The token’s immediate trajectory hinges on whether key long-term moving averages can hold against broader macro sell pressure.

       XRP/USDT WEEKLY CHART STRUCTURAL MODEL

  Price ($)
    ^
2.14|---------------------------------------------------- [161.8% Fib Target]
    |
    |                                  /  (Aug 22 Peak: $1.69)
1.69|---------------------------------/-----------------
    |                                /
1.43|-------------------------------/------* <----------- Current Price ($1.43)
1.37|==============================/========*========== [200-Week EMA Support]
    |                             /
1.15|----------------------------/----------------------- [23.6% Fib Support]
    |                           /
0.50|--------------------------/------------------------- (Nov 2024 Base)
    +----------------------------------------------------> Time
Key Technical Levels
- Primary Support (200-Week EMA): $1.37 — The 200-week Exponential Moving Average represents the line in the sand for medium-term market bulls. Historically, this dynamic technical boundary has served as a decisive trend driver.
- Secondary Support (23.6% Fibonacci Retracement): $1.15 — Should the $1.37 level fail to hold, the next structural support zone sits at $1.15, marking a classic deeper correction area within the broader multi-week rally.
- Upside Resistance (161.8% Fibonacci Extension): $2.14 — A successful bounce off key moving averages opens a technical pathway toward the 161.8% Fibonacci expansion target at $2.14.
Historical Precedent: The 200-Week EMA Catalyst
The significance of the 200-week EMA cannot be overstated. In November 2024, XRP staged a multi-month rally that carried the asset from $0.50 to $2.90 shortly after achieving a definitive weekly candle close above its 200-week EMA. Market technicians note that maintaining price action above $1.37 is essential to preserve the structural integrity of the current bull cycle.
+-----------------------------------------------------------------------------------+
|                        BULLISH vs. BEARISH SCENARIO ANALYSIS                      |
+-----------------------------------------------------------------------------------+
| Feature            | Bullish Case (Defends $1.37)  | Bearish Case (Breaks $1.37)  |
+--------------------+-------------------------------+------------------------------+
| Support Test       | Holds 200-Week EMA at $1.37   | Fails 200-Week EMA ($1.37)   |
| RSI Requirement    | RSI prints higher high (>60)  | RSI falls below 50 (Bearish) |
| On-Chain Trigger   | Whales hold/reallocate funds  | Whales dump spot on Binance  |
| Price Target       | Retest $1.69; Push to $2.14   | Retest 23.6% Fib at $1.15    |
| ETF Flow Impact    | Institutional inflows absorb  | Spot selling overpowers      |
|                    | sell pressure                 | institutional buying         |
+--------------------+-------------------------------+------------------------------+
Oscillators and Momentum Indicators
- Relative Strength Index (RSI): The weekly Relative Strength Index currently reads at 53.0. This placement keeps the oscillator in neutral-to-bullish territory, leaving ample room for upward movement without being overbought. However, to confirm a sustained bullish continuation, momentum traders will be looking for the weekly RSI to break above its prior local swing high and push toward the 60–70 zone.
Future Scenarios: Bullish Continuation vs. Bearish Retracement
Scenario A: Bullish Defense and Expansion to $2.14 (Higher Probability)
Under this scenario, the combination of robust ETF demand ($23.87M daily inflows) and elevated network address usage (+654%) provides a price floor at the 200-week EMA ($1.37). As broader crypto market volatility stabilizes, spot buyers step in to defend this moving average. A confirmed bounce off $1.37 re-engages sidelined momentum capital, driving price action back toward the recent swing peak of $1.69. A sustained close above $1.69 would pave the way for a rally toward the macro Fibonacci extension target of $2.14.
Scenario B: Bearish Breakdown to $1.15 Retracement (Lower Probability)
If broader market corrections intensify across Bitcoin and Ethereum, or if whale inflows into Binance transition into heavy spot selling orders, XRP could break down below its critical support at $1.37. A daily candle close beneath the 200-week EMA would invalidate the short-term bullish thesis, triggering a period of broader consolidation. In this event, technical stop-loss triggers would likely push the asset down to retest its key Fibonacci retracement support level at $1.15 before institutional buyers re-establish control.
Conclusion
Ripple (XRP) stands at a technical and structural crossroads. While intraday pullbacks to $1.43 reflect short-term macro headwinds, key metrics paint a more constructive underlying picture. Network engagement on the XRP Ledger has expanded significantly, whale exchange flows reflect strategic positioning rather than systemic panic, and institutional investors—led by major banking institutions—are accumulating positions at an unprecedented pace.
As long as XRP defends its long-term support at the 200-week EMA ($1.37), the broader market structure remains favorable for institutional accumulation, keeping the mid-term target of $2.14 firmly in focus for market participants.