Executive Overview
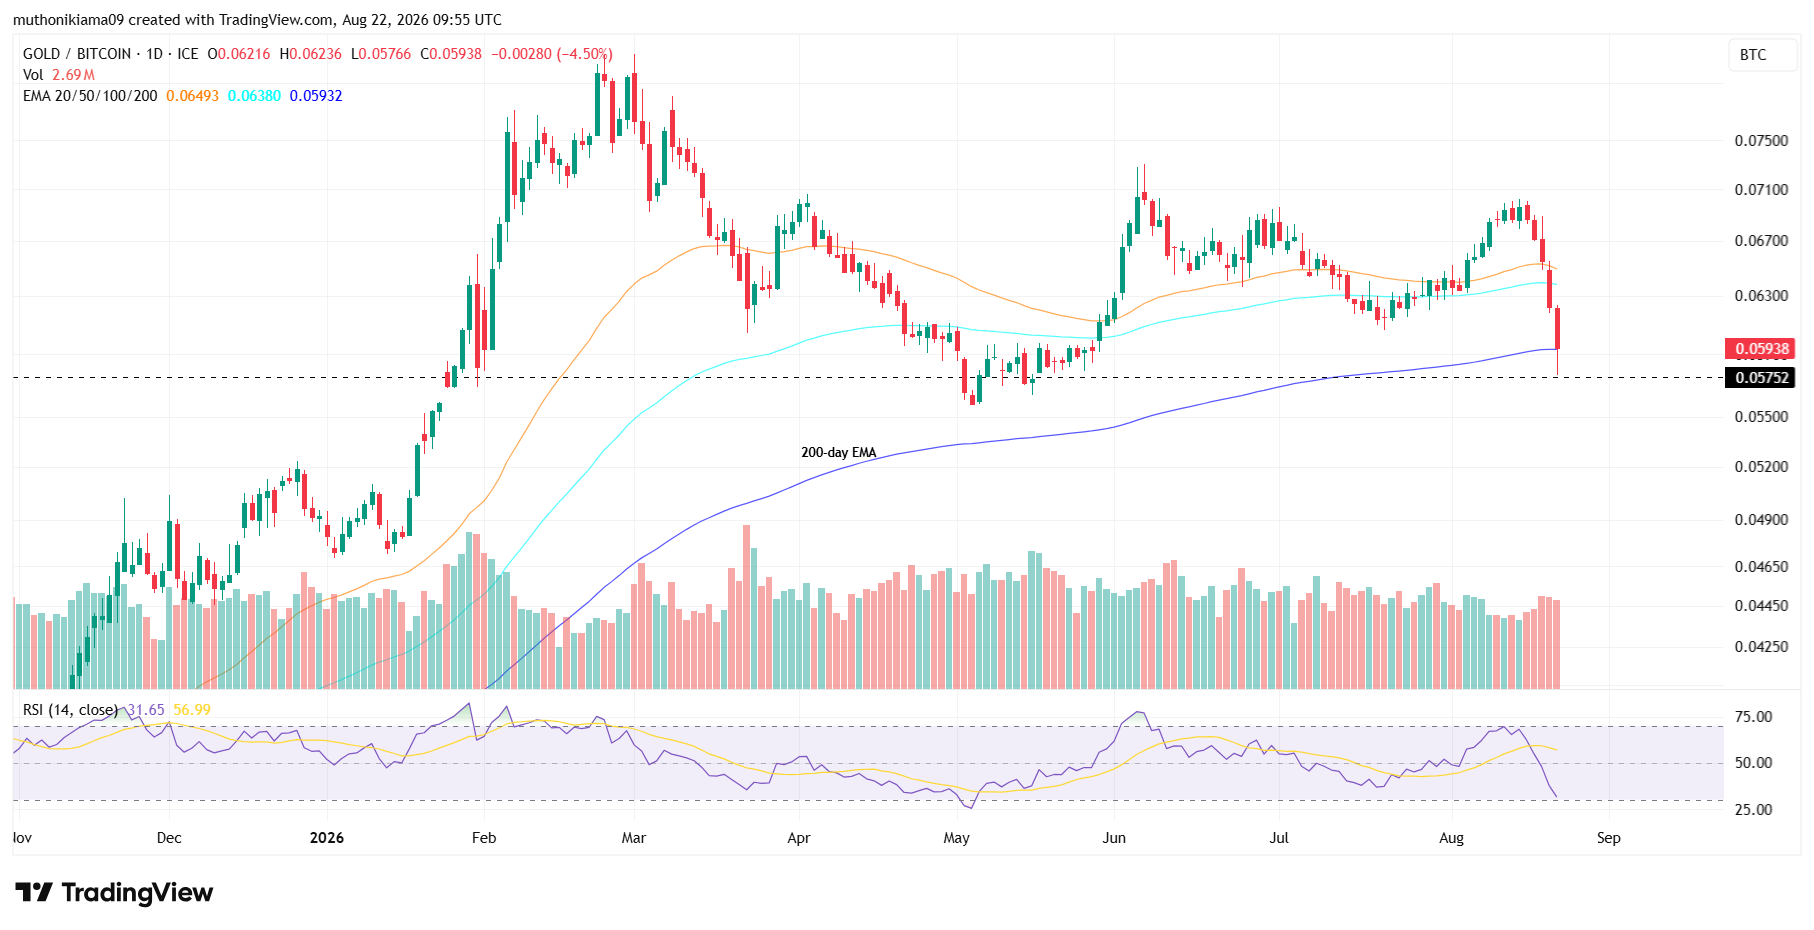
This significant divergence in momentum has pushed the Gold-to-Bitcoin (XAU/BTC) ratio down from 0.070 to 0.057—a 23% drawdown in under a week—marking its lowest level since May. Technical indicators show the ratio actively testing crucial multi-month support at its 200-day Exponential Moving Average (EMA) of 0.059. A sustained close below this threshold would signal a macro-level technical breakdown, reinforcing a broader secular outperformance of digital assets over traditional precious metals.
       XAU/BTC Ratio Trajectory (Aug 17 – Present)

  0.075 ┤
  0.070 ┤  ● (Aug 17: 0.070)
  0.065 ┤
  0.060 ┤───────[ 200-Day EMA: 0.059 ]───────────────────
  0.055 ┤     ● (Current: 0.057 - Lowest since May)
        └─────┬───────────────────────────────────────────
           Aug 17                               Current
This market dynamic coincides with high-profile endorsements from legacy finance figures. Billionaire hedge fund manager Ray Dalio, founder of Bridgewater Associates, has publicly urged institutional and retail investors to incorporate Bitcoin alongside gold into their portfolios. Dalio’s rationale centers on the accelerating structural crisis surrounding global debt monetization, particularly in the United States, where national debt recently breached the unprecedented $40 trillion mark. As macroeconomic liquidity conditions shift in response to fiscal interventions, market participants are re-evaluating the role of scarcity-driven, non-sovereign stores of value.
Detailed Chronology & Macroeconomic Catalysts
The primary driver of the recent rally in hard assets is the expanding U.S. fiscal imbalance. The crossing of the $40 trillion national debt milestone marked a critical psychological threshold for global debt markets, sharpening focus on the long-term sustainability of sovereign debt obligations.
                  U.S. Macro Debt & Liquidity Transmission

  ┌───────────────────────────┐      ┌───────────────────────────┐
  │ U.S. National Debt Exceeds│ ───► │  Treasury Buybacks via    │
  │        $40 Trillion       │      │   Sec. Scott Bessent      │
  └───────────────────────────┘      └─────────────┬─────────────┘
                                                   │
                                                   ▼
  ┌───────────────────────────┐      ┌───────────────────────────┐
  │ Institutional Allocation  │ ◄─── │  Market Liquidity Surge & │
  │   to BTC & Gold Hedges    │      │  Dollar Debasement Fears  │
  └───────────────────────────┘      └───────────────────────────┘
In response to tightening financial conditions and rising yields on government issuance, U.S. Treasury Secretary Scott Bessent initiated strategic Treasury buybacks. By systematically purchasing outstanding federal debt securities, the U.S. Treasury aims to smooth market functioning, alleviate yield curve volatility, and inject liquidity directly into money markets.
The Mechanics of Debt Monetization and Asset Selection
- Liquidity Expansion: Treasury buybacks function as an effective injection of capital into the banking sector, increasing systemic liquidity without relying solely on traditional central bank rate cuts.
- Fiat Debasement Concerns: When market liquidity is artificially expanded to service mounting debt obligations, real yields decline. This incentivizes capital to seek shelter in assets immune to algorithmic or political supply expansion.
- Differential Asset Velocity: While both gold and Bitcoin benefit from liquidity injections, Bitcoin’s fixed supply issuance schedule and lower liquidity market cap yield higher price elasticity. As a result, capital inflows into digital assets often translate into faster price appreciation compared to physical commodities.
This liquidity shift triggered a sharp reassessment of portfolio hedges between August 17 and August 22. Capital initially allocated to traditional safe havens increasingly migrated into Bitcoin, amplifying its momentum relative to physical gold.

Supporting Context & Metric Analysis
Quantitative Breakdown: Gold vs. Bitcoin Performance
The divergence between gold and Bitcoin becomes clearer when examining their relative returns and ratio mechanics over the five-day window:
| Asset / Indicator | August 17 Baseline | Current Value | Absolute Change | Percentage Change |
|---|---|---|---|---|
| Bitcoin (BTC/USD) | $62,000 | $77,200 | +$15,200 | +24.52% |
| Gold (XAU/USD) | $4,300 / oz | $4,600 / oz | +$300 / oz | +6.98% |
| XAU/BTC Ratio | 0.070 | 0.057 | -0.013 | -18.57% |
| 200-Day EMA (XAU/BTC) | — | 0.059 | Below Support | Bearish Breakdown |
                       5-Day Performance Comparison

  Bitcoin (BTC)  [████████████████████████████████████████] +24.52%
  Gold (XAU)     [███████████] +6.98%
                 └───────────┴───────────┴───────────┴────┘
                 0%          7%          14%         21%+
Technical Implications of the XAU/BTC Breakdown
The XAU/BTC ratio measures the purchasing power of one ounce of gold denominated in Bitcoin. A declining ratio indicates that Bitcoin is gaining purchasing power faster than gold.
- Breakdown Below 200-Day EMA: The move down to 0.057 places the ratio below its 200-day Exponential Moving Average of 0.059. In technical analysis, a sustained move below a major moving average signals a long-term structural shift in favor of the base denominator (Bitcoin).
- Historical Multi-Month Lows: Reaching levels last seen in May, this breakdown suggests institutional rebalancing. Capital is shifting from analog hedges to digital alternatives, driven by market demand for higher upside capture during periods of liquidity expansion.
Official Statements & Expert Perspectives
Ray Dalio’s Evolving Macroeconomic Thesis
Ray Dalio, whose macro research frequently influences institutional capital deployment, provided key commentary on the changing dynamics between sovereign debt and non-sovereign assets.
"National debts are soaring at an unprecedented pace, creating an urgent need for investors to diversify their capital outside of traditional fiat-denominated debt instruments. Both Bitcoin and gold represent assets that cannot be printed by governments, giving them a structural advantage in an environment characterized by persistent fiscal deficits."
— Ray Dalio, Founder of Bridgewater Associates
This perspective marks a notable pivot in Dalio’s public positioning:
  Ray Dalio's Macro Thesis Evolution:

  [Previous Stance]                       [Current Stance]
  - Favored Gold exclusively              - Advises Dual-Asset Allocation (BTC + Gold)
  - Highlighted AI stock bubble risks     - Cites $40T U.S. Debt as primary macro threat
  - Sceptical of BTC volatility           - Recognizes non-sovereign nature of BTC
Previously, Dalio advised market participants to favor gold over Bitcoin, pointing to elevated valuations in technology and AI equities as potential catalysts for a broader liquidity contraction. However, with U.S. national debt breaching $40 trillion and Treasury buybacks actively expanding balance sheet operations, Dalio’s updated model emphasizes holding a basket of non-sovereign, hard assets—explicitly naming Bitcoin alongside gold as a necessary counterweight to sovereign credit risk.
Geopolitical Realities & Market Headwinds
Despite strong technical momentum in monetary hedges, macro assets face emerging risks from geopolitical friction. Recent statements from Washington regarding intent to impose heightened economic pressure and sanctions on Iran have introduced potential volatility into energy markets and global supply chains.
Dual-Impact Geopolitical Dynamics
- Short-Term Risk Off Pressure: Sharp escalations in international tensions typically cause brief liquidity freezes, leading market participants to de-risk portfolios and move into short-term cash equivalents.
- Long-Term Structural Support: Persistent geopolitical friction often accelerates the fragmentation of global settlement systems. This structural shift highlights the utility of neutral, borderless monetary networks like Bitcoin, which operate outside sovereign banking infrastructure.
Technical Outlook: Bitcoin Bull Flag & Price Discovery Scenarios
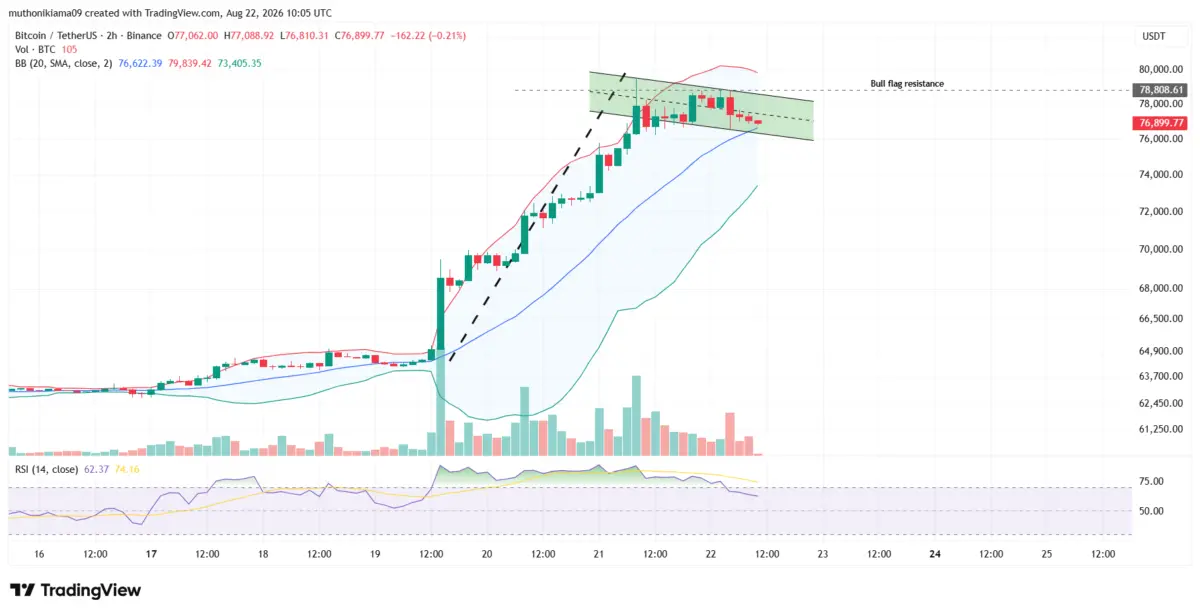
From a technical perspective, Bitcoin’s short-term market structure remains firmly bullish, despite consolidating below its recent peak. On the two-hour chart, price action has formed a classic bull flag pattern, characterized by a sharp upward pole followed by a tight, downward-sloping consolidation channel.
                  BTC/USD 2-Hour Chart: Bull Flag Pattern

  $80,000 ┼──────────────────────────────────────────── Target Projection: >$80,000
          │                                            /
  $78,800 ┼───────────────┬───┐                       /
          │              /│   │  (Bull Flag)        /
  $77,200 ┼─────────────/─┼───┴──●─────────────────/──── Current Price Level
          │            /  │                       /
  $75,000 ┼───────────/───┴──────────────────────/────── Critical Invalidations
          │          /              (Channel)   /
  $62,000 ┼─────────●               └───────────┘
          └─────────┴───────────────────────────────────
                  Aug 17                      Aug 22
Key Levels & Momentum Oscillators
- Resistance & Breakout Threshold ($78,800): A decisive two-hour candle close above the upper boundary of the flag at $78,800 would confirm a technical breakout. This would project an extension past the psychological $80,000 resistance level into open price discovery.
- Support & Invalidation Level ($75,000): The bullish thesis relies on price staying above key structural support at $75,000. A breakdown below this level would invalidate the bull flag pattern, suggesting a deeper retracement driven by short-term profit-taking.
- Relative Strength Index (RSI) Reset: The 14-period RSI on lower timeframes has cooled from an extreme overbought reading of 88 down to 63. This moderation indicates that excessive leverage has been flushed out while market momentum remains in bullish territory. This reset often provides the technical footing required for a subsequent leg higher.
Strategic Implications & Synthesis
The rapid decline in the XAU/BTC ratio highlights an ongoing shift in how institutional markets evaluate store-of-value assets. While gold remains a foundational hedge against market stress, Bitcoin’s structural scarcity, transportability, and high responsiveness to fiat liquidity expansions have positioned it as a preferred alternative during periods of debt monetization.
As systemic national debt approaches $40 trillion and fiscal authorities rely on structural liquidity interventions like Treasury buybacks, non-sovereign assets are increasingly acting as institutional safe havens. If Bitcoin can clear immediate resistance at $78,800 while maintaining its lead over gold, the market could see further rotation from traditional safe-haven assets into digital alternatives. Investors will be monitoring incoming macro data, geopolitical developments, and technical confirmations to see if this trend continues.