Executive Overview
Prominent market intelligence reveals an extraordinary 654.71% spike in active addresses on the XRPL network over a single monitoring window, elevating daily active participating wallets from 47,180 to over 356,000. Concurrently, while general linear derivatives volume experienced a slight pull-back, options trading volume exploded by nearly 299%, signalling that sophisticated market participants are aggressively acquiring non-linear protection and asymmetric exposure in anticipation of a decisive breakout.
This localized network revival is unfolding against a broadly bullish macroeconomic backdrop for digital assets. Global cryptocurrency market capitalization recently expanded by 2.47% to reach $2.68 trillion, galvanized by Bitcoin’s brief ascent above $80,000 and seven consecutive days of net inflows into institutional spot Bitcoin exchange-traded funds (ETFs). As Ethereum simultaneously reclaims seven-month highs above $2,500, the broader market environment appears ripe for liquidity to rotate back into top-tier altcoins. However, for XRP, the immediate path forward hinges on whether technical momentum can overcome formidable overhead resistance at $1.50 to clear a path toward $1.60 and $1.70.
+-----------------------------------------------------------------------+
|                         XRP NETWORK & MARKET SNAPSHOT                 |
+-----------------------------------------------------------------------+
| Current Spot Price          | $1.4897 (~$1.50 Resistance Zone)        |
| 7-Day Performance           | +50.00% (Rally from $1.00 base)          |
| Active XRPL Addresses       | 356,070 (+654.71% from 47,180)          |
| Options Volume              | $36.70 Million (+298.79%)               |
| Options Open Interest       | $140.74 Million (+25.73%)               |
| Derivatives Open Interest   | $3.73 Billion (+0.35%)                  |
| Relative Strength Index     | 59.94 (4-Hour Chart)                    |
| Global Crypto Market Cap    | $2.68 Trillion (+2.47%)                 |
+-----------------------------------------------------------------------+
Detailed Chronology: From the $1.00 Floor to $1.50 Resistance
Phase 1: The Macro Spark and 50% Surge
The current market structure for XRP began taking shape following an aggressive multi-day rally that lifted the token out of its sub-dollar range. For weeks, XRP had languished near the $1.00 mark, pinned by broader market indecision and systemic liquidity compression across mid-cap crypto assets.
The catalyst for a change in sentiment emerged from a sharp, cross-market macro recovery. Led by Bitcoin’s multi-session rally—which saw the flagship cryptocurrency gain more than 20% over three trading days to briefly breach $80,000—risk-on capital surged back into digital asset venues. Spot Bitcoin ETF inflows sustained an uninterrupted seven-day winning streak, driving a 78% surge in overall trading volumes as institutional venues reactivated buying programs. XRP tracked this broader tide, launching a fast 50% weekly price expansion that culminated in a retest of the psychologically significant $1.50 supply ceiling.
  Price ($)
   1.70 +-------------------------------------------------------+ [Target 2]
        |                                                       |
   1.60 +-------------------------------------------------------+ [Target 1]
        |                                   /---               |
   1.50 +----------------------------------/-------------------+ [Resistance]
        |                                 /         (Current)  |
   1.40 +--------------------------------/------------*--------+ [Support 1]
        |                               /                       |
   1.30 +------------------------------/------------------------+ [Support 2]
        |                             /                         |
   1.00 +----------------------------/--------------------------+ [Base]
        +-------------------------------------------------------+
          Day 1      Day 3        Day 5       Day 7      Current
Phase 2: The Shift to Consolidation and Options Positioning
Upon touching the $1.50 level, the vertical expansion paused. Over the trailing 24-hour period, XRP price action settled into a tight horizontal range between $1.48 and $1.50, slightly lagging behind the broader altcoin market’s immediate gains. However, under the surface of this price consolidation, structural activity within derivatives markets began to undergo a distinct transformation.
Rather than unwinding leveraged exposure entirely, market participants altered their strategy:
- Linear Derivatives De-leveraging: Total futures and perpetual swaps volume fell 8.19% down to $8.07 billion, signaling that directional day-traders were stepping back from short-term linear bets.
- Non-Linear Volatility Accumulation: Simultaneously, options volume surged by 298.79% to reach $36.70 million. Open interest across options contracts jumped 25.73% to $140.74 million.
This divergence points to sophisticated traders utilizing call and put options to hedge delta exposure or position for an explosive, directional volatility expansion out of the $1.48–$1.50 consolidation band.

Supporting Context & Deep-Dive Metrics
On-Chain Dynamics: The 654% Active Address Surge
The fundamental narrative underpinning XRP’s current technical posture is anchored in on-chain metrics on the XRP Ledger. Data highlighted by market analyst Ali Charts reveals a staggering expansion in active network participation.
XRP Ledger Active Addresses Expansion:
  Previous Baseline : [███] 47,180
  Current Level     : [████████████████████████████████████████] 356,070 (+654.71%)
In network analysis and quantitative valuation models, sustained address growth serves as an indicator of real structural demand. An increase of 308,890 active addresses within a short timeframe suggests a significant influx of unique wallets interacting with smart contracts, settlement channels, or exchange deposit infrastructures.
Historically, address explosions of this magnitude precede elevated price volatility. While a spike in network participation does not inherently guarantee an immediate upward trajectory, it confirms that the asset is undergoing an organic liquidity expansion, reducing the likelihood of a liquidity-starved sell-off.
Derivatives Disconnect: Options Explosion vs. Futures Contraction
A granular examination of Coinglass derivatives data yields crucial context on how institutional and sophisticated desks are pricing short-term risk for XRP.
+---------------------------------------------------------------------------+
|                        DERIVATIVES BREAKDOWN TABLE                        |
+---------------------------------------------------------------------------+
| Metric                     | Value         | Period Change (%)            |
+----------------------------+---------------+------------------------------+
| Aggregate Derivatives Vol  | $8.07 Billion | -8.19%                       |
| Total Futures Open Interest| $3.73 Billion | +0.35%                       |
| Options Trading Volume     | $36.70 Million| +298.79%                     |
| Options Open Interest      | $140.74 Million| +25.73%                      |
+---------------------------------------------------------------------------+
The metrics depict a classic pre-breakout setup:
- Futures Open Interest Resiliency: Despite the 8.19% drop in total derivatives turnover, futures open interest held firm, ticking up slightly by 0.35% to $3.73 billion. This indicates that major capital allocators are maintaining their core leveraged positions rather than taking profits into the $1.50 resistance zone.
- Options Volume Surge: The 298.79% spike in options trading volume indicates an aggressive shift toward asymmetric risk profiles. Traders are paying premiums for calls to capture prospective upside above $1.60 while simultaneously acquiring protective puts to insulate against a potential drop below $1.40.
Macro Synchronization: Bitcoin ETF Inflows and Ethereum’s Multi-Month Highs
XRP’s internal dynamics are reinforced by macro tailwinds across the broader digital asset ecosystem.
- Institutional Inflows: Bitcoin’s price appreciation to $80,000 has been backed by institutional capital entering through spot ETF wrappers. Seven consecutive trading days of net positive inflows have anchored spot order books, dampening market-wide downside risk.
- Altcoin Liquidity Rotation: Ethereum’s surge to the $2,425–$2,530 corridor—marking its highest price point in nearly seven months—signals a willingness among capital allocators to move down the risk curve from Bitcoin into high-market-cap smart contract and payment networks.
With total crypto market capitalization expanding 2.47% to $2.68 trillion, overall liquidity conditions remain favorable for high-cap assets like XRP.
Official Statements & Expert Commentary
Commenting on the on-chain data, cryptocurrency quantitative analyst Ali Charts provided context regarding the active address metric:

"$XRP NETWORK ACTIVITY EXPLODED! Active addresses have surged 654.71%, jumping from 47,180 to 356,070. That kind of spike typically signals a sharp increase in network participation and is often accompanied by higher price volatility."
Financial analysts tracking institutional derivatives flows note that the combination of expanding on-chain address counts and surging options open interest typically reflects institutional rebalancing. When options volume spikes by nearly 300% alongside rising address activity, market makers are usually forced to adjust their delta-hedging strategies. This structural dynamic can accelerate upward price momentum if key resistance levels are breached, trigger short squeezes, or spark rapid gamma squeezes in the spot market.
Technical Analysis & Strategic Outlook
Indicator Diagnostics: RSI and MACD Realignment
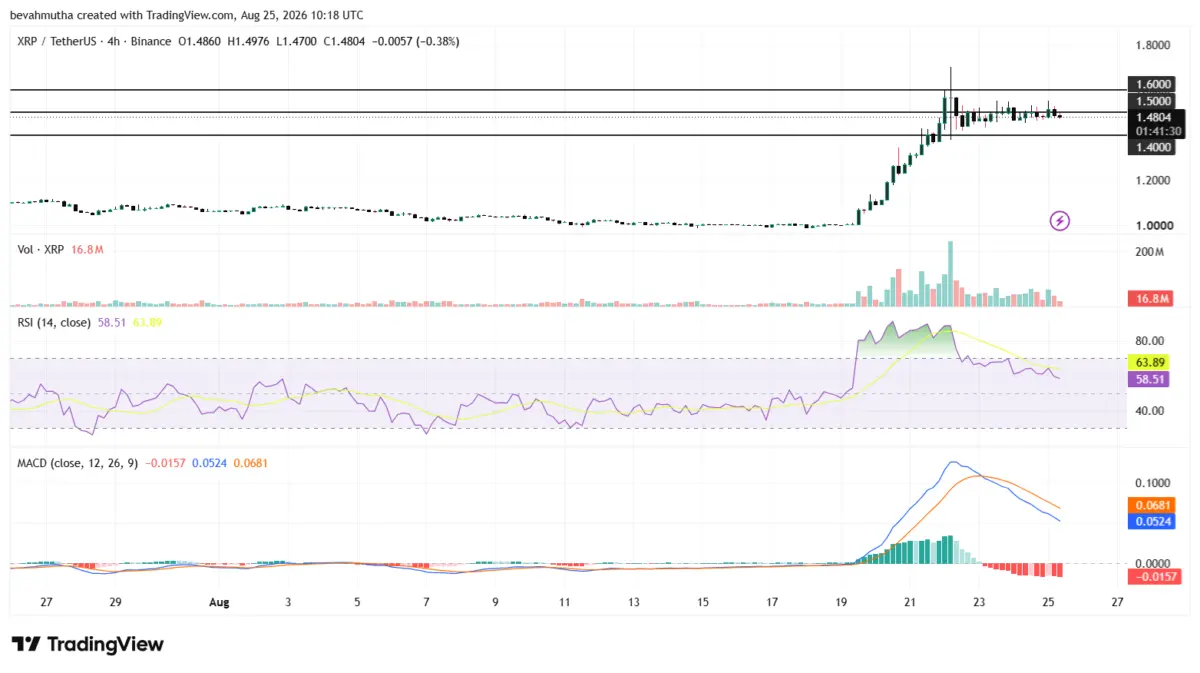
A diagnostic breakdown of the XRP/USDT 4-hour technical chart reveals a bullish consolidation phase beneath primary overhead resistance.
+-----------------------------------------------------------------------+
|                      4-HOUR TECHNICAL INDICATORS                      |
+-----------------------------------------------------------------------+
| Indicator                 | Value / Reading      | Interpretation     |
+---------------------------+----------------------+--------------------+
| Relative Strength Index   | 59.94                | Bullish Control    |
| MACD Line vs Signal Line  | Below Signal Line    | Mild Bearish Cross |
| MACD Histogram            | Negative             | Consolidation      |
| Core Trendline Support    | $1.4000              | Primary Bull Pivot |
| Primary Overhead Target   | $1.6000              | Immediate Resistance|
+-----------------------------------------------------------------------+- Relative Strength Index (RSI): The 4-hour RSI currently prints at 59.94. Having cooled down from overbought conditions above 70 during the initial surge from $1.00, the current reading indicates healthy reset dynamics. The index remains comfortably above the neutral 50 midline, confirming that buyers retain control of the medium-term trend.
- Moving Average Convergence Divergence (MACD): The MACD line has edged slightly below the signal line, registering a negative histogram reading. This technical divergence reflects the current pause near $1.50. Rather than signaling a trend reversal, this pattern suggests temporary momentum digestion prior to the next expansion attempt.
4-Hour Chart Structure:

  $1.70 +-------------------------------------------------------+ [Target 2]
        |                                                       |
  $1.60 +-------------------------------------------------------+ [Target 1]
        |                        /-------                      |
  $1.50 +=======================/==============================+ [Key Resistance]
        |                      /                               |
  $1.49 +.....................*.............*..................+ [Current Range]
        |                    /                                 |
  $1.40 +-------------------/----------------------------------+ [Support Line]
        |                  /                                   |
  $1.30 +-----------------/------------------------------------+ [Secondary Support]
        +-------------------------------------------------------+
Future Scenario Matrix: Bullish Expansion vs. Pullback Risk
The Bullish Scenario: Breakout Above $1.50 Toward $1.70
For the bullish trajectory to materialize, XRP must register a decisive four-hour candle close above the $1.50 resistance level, backed by a surge in spot volume.
- Target 1 ($1.60): A breach of $1.50 would likely trigger a rapid run toward $1.60, as option market makers holding short calls move to delta-hedge their exposure by buying spot XRP.
- Target 2 ($1.70): If buying pressure persists and broader crypto market sentiment remains positive, sustained spot demand could extend the rally toward $1.70, completing a multi-week continuation pattern.
The Bearish Scenario: Rejection at $1.50 and Downside Retest
Should overhead supply at $1.50 prove insurmountable in the near term, XRP risks a corrective pullback to retest lower liquidity zones.
- Support 1 ($1.40): The immediate line of defense rests at $1.40. As long as price holds above this level, the macro market structure remains structurally bullish.
- Support 2 ($1.30): A failure to hold $1.40 would expose the secondary support zone at $1.30, representing a deeper pull-back to test the conviction of medium-term buyers before any secondary attempt at a breakout.
Strategic Conclusion
XRP sits at a critical technical and fundamental inflection point. The powerful combination of a 654.71% surge in active addresses, a 298.79% explosion in options activity, and steady spot ETF inflows across the crypto asset sector creates a strong backdrop for the token. While short-term technical indicators like the MACD point to continued temporary consolidation, the broader structural trend remains firmly constructive as long as price stays above $1.40. A clean breakout above $1.50 remains the key trigger market participants are watching for the next major leg up.