Executive Overview
The ongoing consolidation phase reflects a broader market sentiment of cautious observation. Rather than displaying impulsive breakouts or capitulatory sell-offs, $ADA$ is compressing within a tight range as participants weigh macro crypto trends against network-specific developments. This equilibrium suggests that the market is waiting for a catalyst—or a decisive structural break—to dictate the next directional wave.
For market participants, the current zone acts as an observational testing ground. A successful defense of this multi-indicator confluence could spark a relief rally or a short-term recovery toward overhead resistance levels. Conversely, a failure to hold this line risks invalidating the current local market structure, potentially inviting a deeper corrective phase toward historical liquidity pools. As volatility compresses, understanding the interplay between these technical markers becomes paramount for navigating Cardano’s immediate market trajectory.
Detailed Chronology: How $ADA$ Reached the Confluence Zone
To fully understand Cardano’s current technical standing, it is necessary to retrace the sequence of price movements that led to this structural convergence. The journey to the $0.618$ Fibonacci support zone was shaped by a combination of broader digital asset market corrections and localized profit-taking following previous impulsive runs.
Phase 1: The Post-Impulse Cooling Period
Earlier in the market cycle, $ADA$ exhibited notable upside momentum, sparking optimism across the community and driving aggressive buying pressure. However, like many major altcoins, this impulsive expansion eventually met significant overhead resistance. As macro headwinds and shifting liquidity dynamics affected the broader cryptocurrency ecosystem, $ADA$ began a controlled retracement. This pullback was not characterized by panic, but rather by a systematic cooling of overextended technical indicators, allowing the market to flush out excessive leverage.
Phase 2: Structural Step-Down and Volume Redistribution
As the correction deepened, price action transitioned from a dynamic uptrend into a corrective channel. During this descent, trading volume began to contract, signaling a decline in aggressive selling pressure. Sellers managed to push the asset lower, but each incremental drop met institutional-grade absorption. This dynamic led to the formation of a bullish order block—an area on the chart where institutional liquidity was previously injected into the market, often acting as a reliable springboard when revisited.
Phase 3: Convergence at the Crossroads
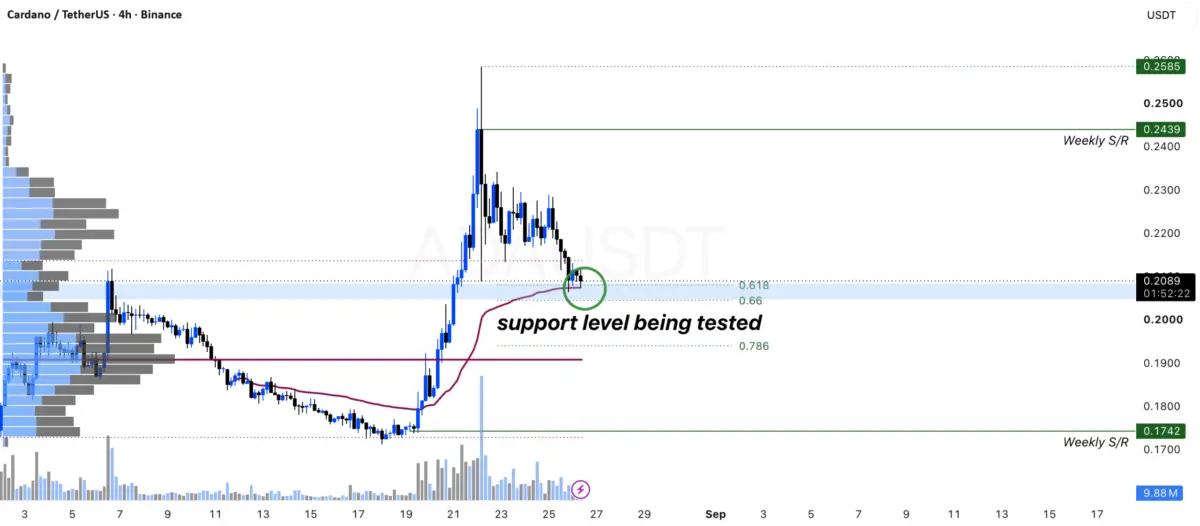
In recent sessions, the convergence of the $0.618$ Fibonacci retracement level, the aforementioned bullish order block, and the local $VWAP$ benchmark culminated in the creation of the current consolidation zone. Price action has effectively stalled within this tight band. The daily candles display diminishing bodies and narrowing ranges, classic hallmarks of market compression. This chronology illustrates that the current consolidation is not a random occurrence, but the mathematical and structural culmination of preceding market phases intersecting at a single price threshold.
Supporting Context & Metrics: Technical Breakdown of the Confluence Zone
The significance of Cardano’s current price area cannot be overstated, primarily because it relies on the confluence of three distinct, highly regarded analytical methodologies. Evaluating these metrics provides deeper insight into why market participants are watching this region so closely.
[ Bullish Order Block ] ----+
                            |
[ 0.618 Fibonacci Level ] --+---> [ Current ADA Consolidation Zone ]
                            |
[ VWAP Support Indicator ] -+
1. The $0.618$ Fibonacci Retracement Level
Often referred to by traders as the "golden ratio," the $0.618$ Fibonacci retracement level is one of the most widely monitored metrics in technical analysis. It represents a natural retracement depth in healthy bull markets, frequently acting as the turning point where impulsive trends resume. For $ADA$, holding the $0.618$ level preserves the integrity of the broader macro trend structure, signaling to algorithmic and manual traders alike that the primary upward impulse remains valid.
2. The Bullish Order Block
Order blocks denote zones where large institutional players or "smart money" executed significant buy or sell orders. A bullish order block specifically highlights the last down-candle before a strong upward expansion. When price retraces to this origin point, it frequently encounters residual buy orders left unfilled during the initial move. The presence of this order block underneath current $ADA$ price action provides a fundamental structural cushion, increasing the likelihood of defensive buying.
3. Volume Weighted Average Price ($VWAP$)
Unlike traditional moving averages, $VWAP$ accounts for both volume and price, providing a true benchmark of the average price a security has traded at throughout a specific timeframe, weighted by volume. The alignment of $VWAP$ support with the Fibonacci level and order block creates a triple-confluence zone. When price respects $VWAP$ during a consolidation phase, it typically indicates that market participants are comfortable transacting at these fair-value levels.
Market Psychology and Equilibrium
The interplay of these three factors creates a psychological standoff. Bulls view the zone as a high-probability risk-to-reward entry point, while bears view it as a fragile floor vulnerable to collapse. This balance is reflected in the lack of directional momentum, setting the stage for a volatility expansion once the equilibrium is inevitably broken.
Official Statements and Market Sentiment
While technical indicators provide the quantitative framework for analyzing Cardano, qualitative commentary from market analysts, community figures, and platform updates help contextualize the prevailing sentiment.
Market observers note that $ADA$’s current price behavior mirrors that of several other top-tier layer-1 altcoins experiencing macro consolidation. Analysts frequently emphasize that technical setups, no matter how robust, require confirmation from broader market conditions—such as Bitcoin’s price stability and overall market liquidity—to yield reliable outcomes.
Furthermore, community sentiment remains cautiously optimistic. Long-term stakeholders continue to point toward ongoing developments within the Cardano ecosystem, including network upgrades, governance milestones, and decentralized finance ($DeFi$) adoption metrics, as fundamental underpinnings that insulate the asset against extreme downside risks. However, professional trading desks adopt a more pragmatic view, stressing risk management above all else. Market commentary consistently underscores that assuming support will hold without empirical confirmation is a hazardous strategy. Instead, traders are advised to wait for definitive price action reactions—such as high-volume impulsive breakouts or rejection wicks—before committing significant capital to either long or short positions.
Future Outlook: Scenarios for Cardano’s Next Phase
As $ADA$ continues to compress within its current technical support zone, market participants must prepare for two distinct directional scenarios. The behavior of price around this confluence zone will dictate the tactical roadmap for the weeks ahead.
Scenario A: The Bullish Recovery and Bounce
If $ADA$ successfully defends the support region and develops a sustained bullish reaction, the probability of a short-term recovery increases significantly.
- Catalysts: Increased buying volume, a decisive green candle closing above local resistance, and a reassertion of control by buyers over the $VWAP$.
- Implications: Such a reaction would validate the $0.618$ Fibonacci level and the bullish order block, potentially driving prices toward higher liquidity pools and overhead resistance levels. Subsequent price action confirmation—such as higher lows on lower timeframes—would be required to validate the strength of this recovery.
Scenario B: The Decisive Breakdown and Corrective Expansion
Conversely, if selling pressure intensifies and results in a decisive breakdown below the confluence zone, the current market structure would experience a structural invalidation.
- Catalysts: Macro crypto sell-offs, breakdown of correlated assets like Bitcoin, or a spike in high-volume selling that overwhelms the order block.
- Implications: A confirmed loss of this support cluster would likely accelerate downward momentum, increasing the probability of a deeper corrective move. In this scenario, historical support levels further down the chart would become the primary areas of interest for assessing where buyers might step back in.
Strategic Conclusion
For now, the overarching directive for market participants is patience and vigilance. The confluence zone acts as a natural observational window. Forcing trades within the center of the range exposes investors to unnecessary chop and whipsaw risk. By monitoring how price reacts to the boundaries of this zone, traders can make informed, reactive decisions aligned with market reality rather than speculative assumptions.
Regulatory and Risk Disclosures
Disclaimer: The information and publications provided herein are for informational and educational purposes only and do not constitute financial, investment, trading, or legal advice. Cryptocurrencies are high-risk assets; past performance is not a reliable indicator of future results. Readers must perform their own due diligence or consult an independent financial advisor before making any investment decisions.
Risk Summary & Regulatory Status
- High-Risk Investment: Do not invest unless you are prepared to lose all the money you invest. Cryptocurrency is a high-risk asset class, and you should not expect to be protected if something goes wrong.
- Regulatory Environment: While buying, holding, and trading cryptoassets is legal in various jurisdictions (such as the UK), the cryptocurrency market remains largely unregulated. Once funds enter the crypto ecosystem, there are typically no statutory compensation schemes—such as the Financial Services Compensation Scheme ($FSCS$) or the Financial Ombudsman Service ($FOS$)—to protect against losses.
- Third-Party Independence: Opinions expressed in market analyses reflect the views of the respective authors at the time of publication and do not represent the official stance of platform operators, data providers, or affiliated corporate entities. Always verify timestamps and prevailing market conditions before acting on technical assessments.