Executive Overview
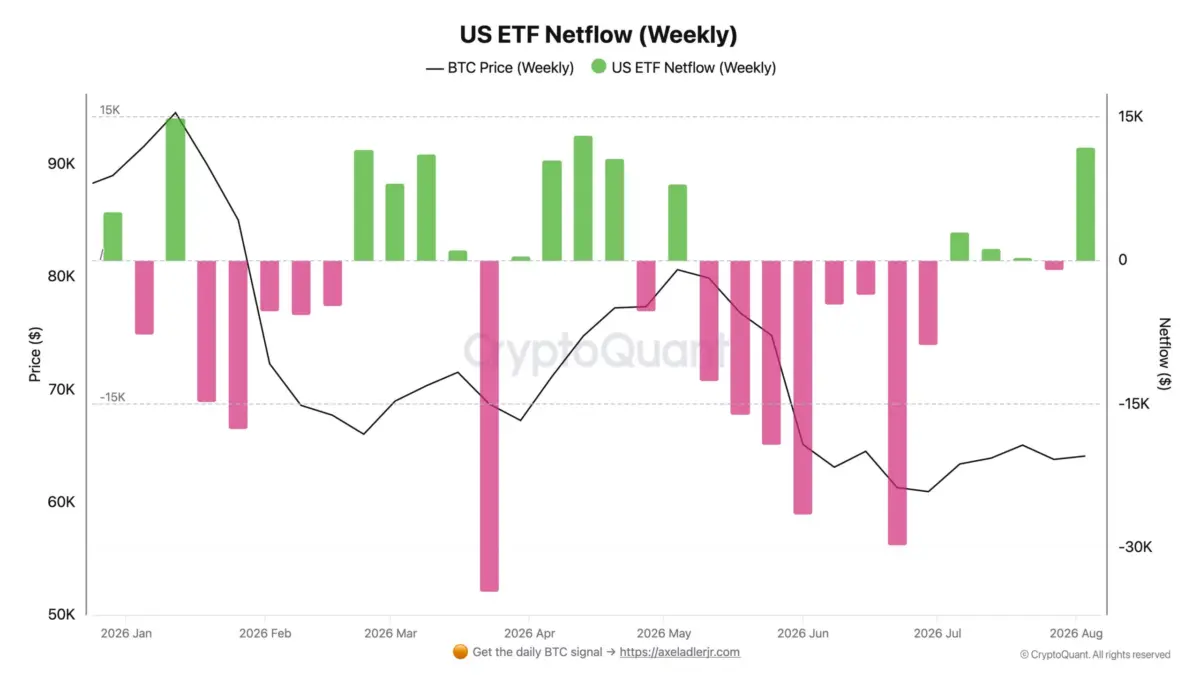
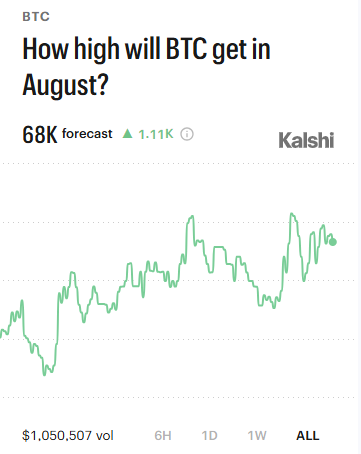
While major altcoins demonstrated concurrent resilience—with Ethereum (ETH) hovering near $1,915 and XRP maintaining its stance around $1.03—traders are primarily focusing on Bitcoin’s immediate chart patterns and speculative forecasts. On the prediction market platform Kalshi, probability metrics point toward a potential push to $68,000 before the end of August. Simultaneously, institutional sentiment appears to have pivoted sharply from the net capital capital flight seen in previous weeks; U.S. spot Bitcoin ETFs recently secured their second-largest weekly inflow of the year, backed by a five-day positive streak.
Adding a structural layer to market sentiment is the U.S. Senate’s administrative progression of the Digital Asset Market CLARITY Act. Although a definitive vote has been rescheduled for September 14, Senate Majority Leader John Thune’s filing of a cloture motion signals formal legislative motion. The combination of technical alignment, sustained institutional buying, and regulatory evolution sets a complex stage for digital asset valuations heading into late Q3.
Detailed Chronology
[Late July - Early August]
├── Institutional outflows exhaust -> Spot Bitcoin ETFs stage a multi-day pivot
[August 3 - August 6]
├── BTC stabilizes above lower support; Kalshi contracts accumulate over $1.05M in volume
[August 7]
├── U.S. Spot BTC ETFs log $98.85M net inflows (5th consecutive winning session)
├── U.S. Spot ETH ETFs attract $49.60M (4th consecutive positive day)
[August 8]
├── Senate Majority Leader John Thune files cloture on the CLARITY Act motion to proceed
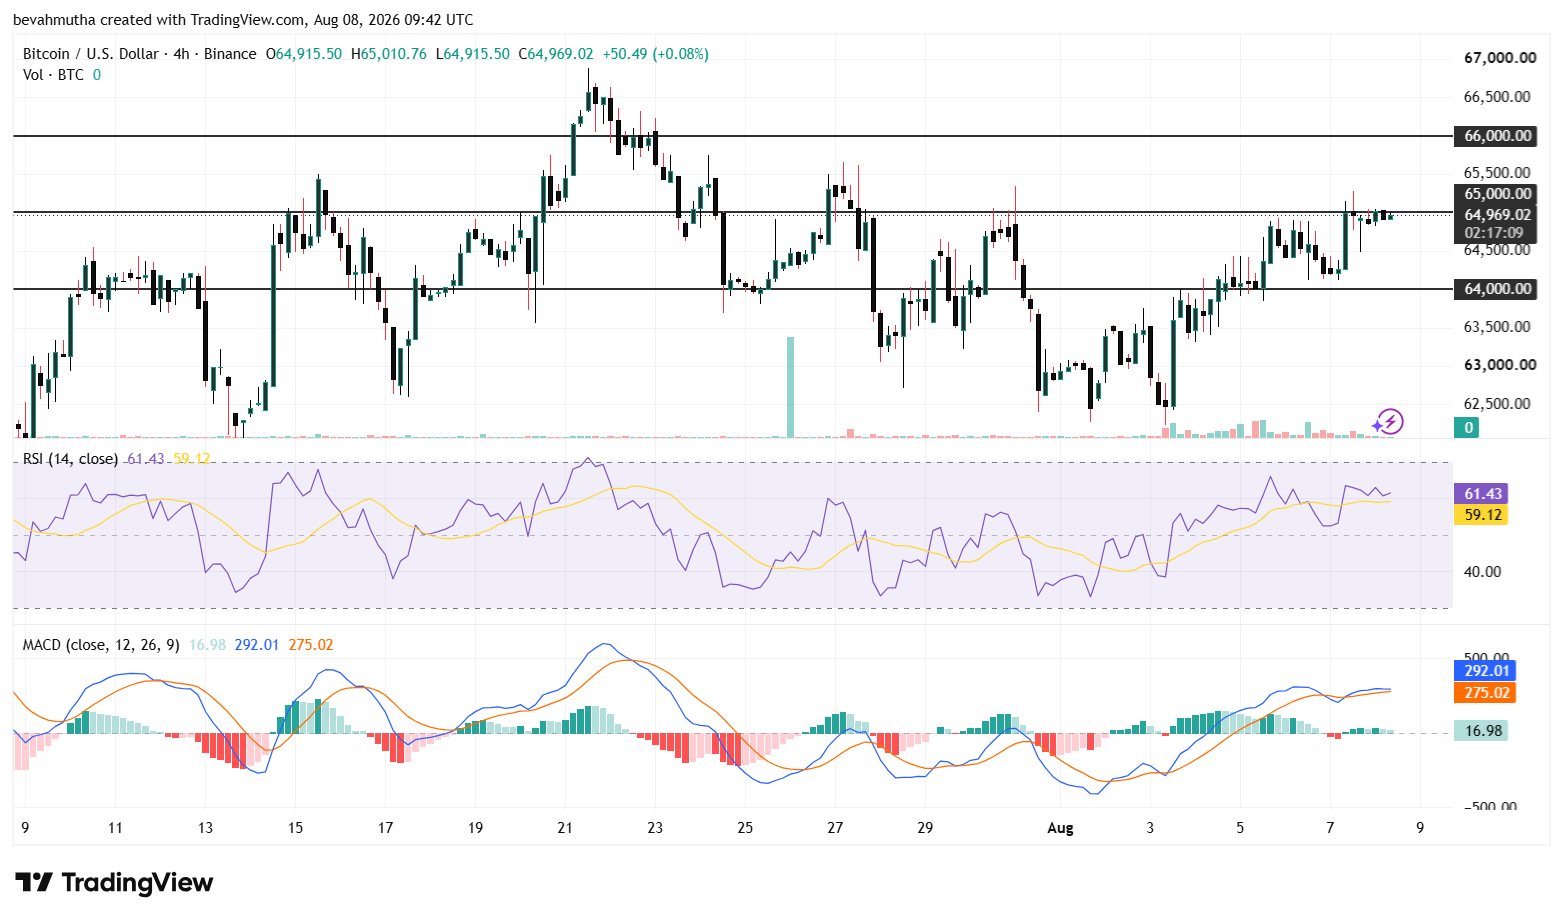
├── Bitcoin tests the key $65,000 resistance zone on high-volume 4-hour charts
└── Crypto market market cap consolidates at $2.21 Trillion (+0.81%)
The current market dynamic is the culmination of structural shifts over the past several trading sessions:
- The Institutional Rebound: Following weeks characterized by minor capital flight and cautious risk management, U.S. spot Bitcoin ETFs reached an inflection point. The transition began with modest net additions, eventually culminating in a five-session winning streak that absorbed over 11,000 BTC from open markets.
- Derivatives and Forecast Market Mobilization: As spot prices recovered from local lows, event-based prediction markets registered a sharp increase in position-taking. Kalshi’s target contract for an August Bitcoin rally toward $68,000 gained liquidity, exceeding $1.05 million in total contract volume as retail and macro traders recalibrated their summer tail-risk models.
- Capitol Hill Parliamentary Maneuvers: On August 8, legislative momentum picked up when Senate Majority Leader John Thune formally filed cloture on the motion to proceed to the Digital Asset Market CLARITY Act. Although the final vote was pushed to mid-September, the procedural step officially brought the framework onto the active Senate calendar.
- Immediate Price Compression: Armed with positive ETF data and regulatory clarity on the horizon, Bitcoin buyers pressed the price from the lower $64,000 support band to a local high of $64,977, setting up a retest of the critical $65,000 ceiling.
Supporting Context & Metrics
To fully grasp the mechanics driving this rally, the market must be evaluated through three distinct lenses: technical indicator configuration, prediction market pricing, and institutional capital flows.
1. Technical Analysis: The Battle at the $65,000 Resistance
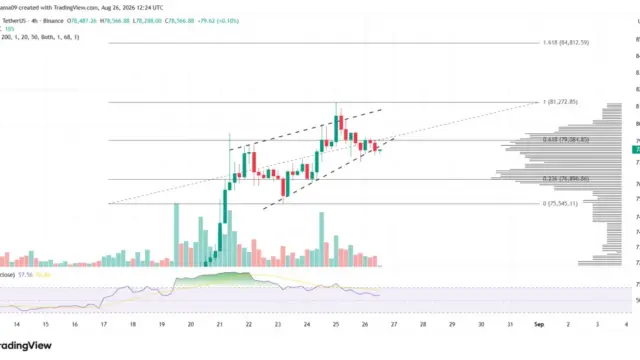
Bitcoin’s price structure on the four-hour temporal timeframe reveals a classical accumulation pattern, characterized by higher lows and steady absorption near upper resistance bands.
Price Targets & Technical Levels:
┌─────────────────────────────────────────┐
│ Target 3: $66,500 (Recent Swing High)   │
│ Target 2: $66,000 (Major Resistance)    │
│ Target 1: $65,500 (Intermediate Hurdle) │
├─────────────────────────────────────────┤
│ CURRENT TEST: $65,000 Resistance Zone   │
├─────────────────────────────────────────┤
│ Support 1: $64,000 (Immediate Support)   │
│ Support 2: $63,000 (Structural Floor)   │
│ Support 3: $62,500 (Invalidation Level) │
└─────────────────────────────────────────┘
The immediate focal point for technical analysts is the $65,000 level, a psychological and structural ceiling that has capped upside moves over recent weeks.

- Relative Strength Index (RSI): The RSI on the four-hour chart currently sits at 61.55. This places the indicator squarely in constructive bullish territory—well above the neutral 50 line—while remaining comfortably below the overbought threshold of 70. This implies that momentum is expanding without immediate exhaustion risks.
- Moving Average Convergence Divergence (MACD): The MACD line registers at 292.66, maintaining a clear position above its signal line at 275.15. The positive histogram expansion reinforces underlying buying pressure, suggesting that momentum favors bulls as long as price action holds above local support.
- Key Support and Resistance Dynamics: A successful, high-volume close above $65,000 opens an immediate pathway toward $65,500, followed by the primary structural target at $66,000. Should momentum push through $66,000, liquidity pools around the recent swing high of $66,500 will likely be exposed. Conversely, a rejection at $65,000 leaves immediate support at $64,000. Secondary defense layers reside at $63,000 and $62,500; a breach below the latter would invalidate the short-term bullish market structure.
2. Prediction Market Dynamics: Kalshi Traders Eye $68,000
While technical charts reflect real-time execution, prediction markets offer insight into forward-looking probability distribution. Regulated forecast exchange Kalshi has seen rising engagement on its August price target contracts.
| Metric | Recorded Value / Status |
|---|---|
| Forecast Target | $68,000 (August Expiry) |
| Contract Volume | Exceeding $1.05 Million |
| Market Allocation Value | ~$1,110 |
| Primary Drivers | ETF Persistence, Institutional Inflows, Regulatory Progress |
The contract, which allows participants to trade binary outcomes regarding Bitcoin hitting $68,000 within the month of August, has accumulated over $1.05 million in trading volume. Traders are displaying cautious optimism, pricing in a continuation of the mid-summer rebound. However, market makers emphasize that prediction market pricing remains highly dynamic, subject to swift recalibration based on real-time volatility spikes, spot liquidity changes, and macroeconomic data releases.
3. Institutional Capital Movements: ETF Inflows Shift into High Gear
Underpinning both spot price performance and derivatives pricing is a visible shift in institutional appetite via U.S.-regulated fund products.
Spot ETF Capital Flow Snapshot (August 7 Data)
──────────────────────────────────────────────────────────
Spot Bitcoin ETFs (Net Daily Inflow):    +$98.85 Million
Spot Bitcoin ETFs (5-Day Accumulation):  ~11,792 BTC (~$754M)
Total Spot BTC ETF Net Asset Value:      $79.50 Billion
Spot Ethereum ETFs (Net Daily Inflow):   +$49.60 Million
Spot Ethereum ETFs (Inflow Streak):      4 Consecutive Sessions
──────────────────────────────────────────────────────────
According to aggregated metrics from SoSoValue and CryptoQuant, U.S. spot Bitcoin ETFs recorded $98.85 million in net inflows on August 7. This marked the fifth consecutive session of positive net flows, capping off a weekly accumulation phase where funds absorbed 11,792 BTC (equivalent to approximately $754 million). This performance represents the second-highest weekly inflow total registered by spot Bitcoin ETFs during the current calendar year.
The cumulative Net Asset Value (NAV) of all active U.S. spot Bitcoin funds has now climbed to $79.50 billion, reflecting both underlying asset appreciation and new capital creation.
This institutional accumulation is not isolated to Bitcoin. U.S. spot Ethereum ETFs secured $49.60 million in net inflows on the same day, marking their fourth straight day of net positive capital allocations. This broader institutional participation underscores a growing appetite for crypto-native asset exposure among traditional portfolio managers.
Official Statements & Legislative Landscape
Beyond chart patterns and exchange order books, the macroeconomic narrative for digital assets remains closely tied to regulatory developments in Washington, D.C. The focus has centered on the Digital Asset Market CLARITY Act, a landmark legislative proposal designed to establish clear jurisdictional boundaries between federal market regulators and provide precise legal definitions for digital commodities versus securities.
Parliamentary Maneuvering in the U.S. Senate
On August 8, Senate Majority Leader John Thune took a formal step forward by officially filing cloture on the motion to proceed to the CLARITY Act.
Procedural Context: In the U.S. Senate, filing cloture on a motion to proceed is the formal mechanism used to limit further debate and force a vote on bringing a bill to the floor for consideration. It requires a three-fifths majority (typically 60 votes) to pass, effectively overcoming potential filibusters and advancing the legislation into active floor debate.
By executing this procedural maneuver, Senate leadership has formally placed the CLARITY Act onto the legislative schedule. While the definitive vote on the bill has been rescheduled for September 14 to allow for committee revisions and floor scheduling, the filing of cloture reflects concrete progress toward regulatory certainty.
Industry and Market Reaction
The legislative update triggered swift commentary across the digital asset ecosystem. Market commentators highlighted the significance of procedural momentum over short-term delays. Popular industry analyst Crypto Rover shared via social media platform X:
"BREAKING: Senate Majority Leader Thune has officially filed cloture on the motion to proceed to the CLARITY Act. The Senate is officially starting the process to advance the CLARITY Act toward a vote. This is HUGE 🚀"
The perspective across institutional trading desks suggests that while the September 14 delay introduces a temporary waiting period, the structural commitment to bring market structure legislation to a vote provides a long-term fundamental tailwind. Establishing regulatory parameters is widely viewed as a prerequisite for sovereign wealth funds, pension funds, and conservative institutional allocators to deploy capital into the asset class at scale.
Future Outlook & Strategic Implications
As the market navigates the remainder of August, traders and institutional strategists are evaluating two distinct paths forward.
                              [Bitcoin Price Action]
                                         │
                   ┌─────────────────────┴─────────────────────┐
                   ▼                                           ▼
         【Bullish Path】                                【Bearish Path】
  • Sustained close > $65,000                     • Rejection at $65,000
  • ETF Inflows continue streak                   • Profit-taking / Macro drag
  • Targets: $65,500 ──► $66,000                  • Supports: $64,000 ──► $63,000
  • Kalshi Macro Extension: $68,000               • Structural Floor: $62,500
The Bullish Case: Breakout to $68,000
For the optimistic scenario outlined by Kalshi contracts to materialize, several conditions must align:
- Definitive Clearance of $65,000: Bitcoin must achieve a decisive, high-volume four-hour or daily close above $65,000. This would likely trigger systematic buy stops and push price action rapidly toward $65,500 and $66,000.
- Persistent ETF Demand: Spot ETF inflows must maintain their positive trajectory, consistently absorbing daily miner issuances and OTC market supply.
- Macro Stability: Broader financial markets must remain stable, allowing risk assets to benefit from favorable monetary policy expectations ahead of the Federal Reserve’s upcoming autumn meetings.
Under this setup, a liquidity sweep of the $66,500 swing highs could provide the necessary fuel to drive valuations toward the $68,000 target before August options and futures contracts expire.
The Bearish Case: Rejection and Support Retest
Conversely, failure to cross the immediate threshold presents downside risks:
- Overhead Resistance Rejection: A repeated inability to clear $65,000 could lead to buyer fatigue, resulting in a retracement back to the immediate support zone at $64,000.
- Loss of Intermediate Floor: If $64,000 fails to hold, the market would likely test secondary structural support at $63,000. A deeper correction down to $62,500 would challenge the short-term bullish thesis, forcing a recalibration of derivatives positioning and potentially pausing the current streak of ETF inflows.
Strategic Conclusion
Bitcoin stands at a critical technical and fundamental juncture. Supported by strong ETF demand, bullish technical indicators (RSI 61.55, MACD cross), and progress on legal frameworks like the CLARITY Act, the broader market setup leans constructive. However, the market must first overcome immediate chart resistance at $65,000 to turn speculative prediction market forecasts into spot market reality.