Executive Overview
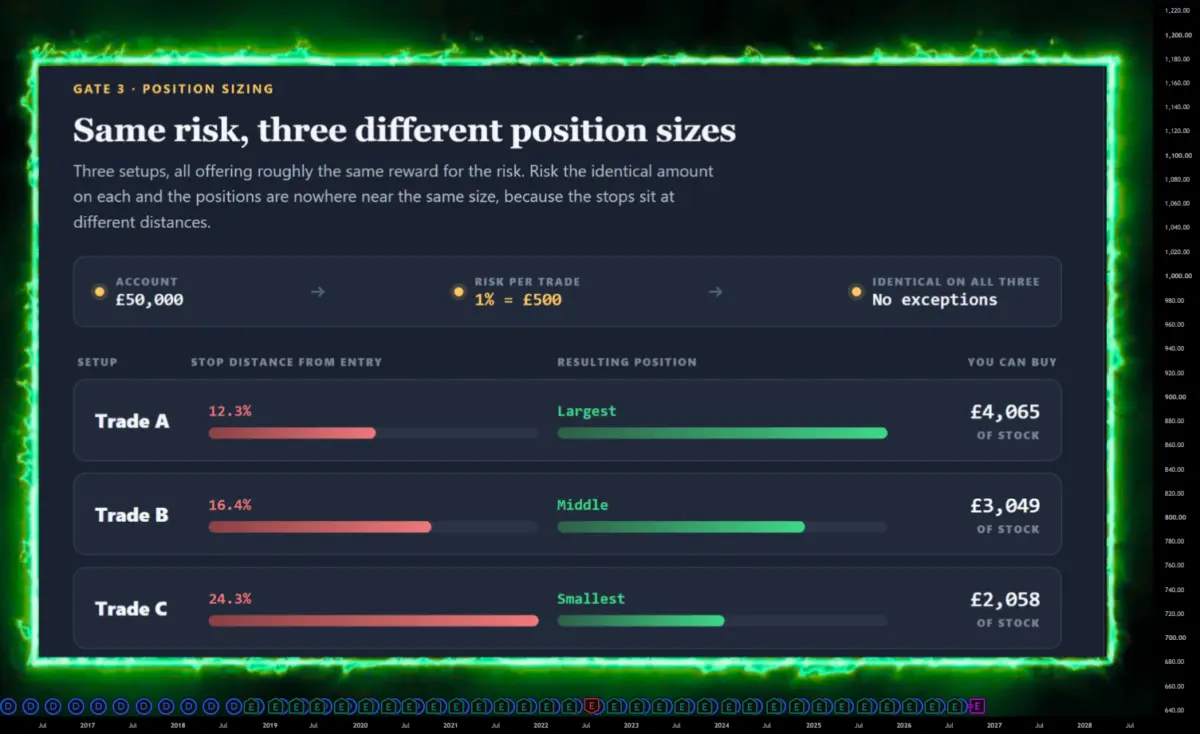
A recent market anatomy breakdown sheds light on a foundational pitfall that traps even intermediate traders: treating superficially identical setups as though they carry the same structural risk. When evaluating three distinct trade configurations—each clearing technical filters and offering a uniform risk-to-reward ratio of approximately 2:1 to 2.5:1—an inexperienced operator might view them as interchangeable variations of the same opportunity.
However, a deeper inspection reveals that their invalidation levels (commonly known as stop-loss distances) sit at drastically different points from the entry price: roughly 12%, 16%, and over 24% away. In the realm of professional risk engineering, this variance is not merely a geometric nuance; it is the primary variable that dictates position sizing.
By failing to adjust share volume based on stop-loss distance, traders routinely commit a silent capital error. They inadvertently expose themselves to wildly asymmetric losses on trades with wide invalidation markers. This comprehensive report explores the mathematical mechanics of volatility-adjusted position sizing, examines the psychological traps that lead to capital mismanagement, and establishes a definitive framework for professional risk control.
Detailed Chronology: The Anatomy of a Three-Way Trade Divergence
To understand how professional risk management diverges from amateur execution, consider a controlled analytical scenario involving three concurrent trade setups identified within a single portfolio session.
Phase 1: Signal Identification and Validation
The trader scans the equities or crypto markets, identifying three distinct charts that meet strict technical criteria. Each setup clears rigorous momentum, volume, and structural checks. Furthermore, all three offer an attractive reward-to-risk profile, promising an upside return roughly 2 to 2.5 times the distance of their respective initial risk parameters.
On the surface, these appear to be three versions of the exact same trade. The technical indicators align, the thesis is sound, and the projected payouts are mathematically attractive.
Phase 2: The Structural Divergence
Upon plotting the trade architecture, the underlying divergence becomes apparent. The difference between the setups is not analytical—it is arithmetic. The invalidation levels—the technical price points where the trade thesis is proven wrong—occupy starkly different coordinates relative to the entry price:
- Setup Alpha: Invalidation sits approximately 12.3% below the entry price.
- Setup Beta: Invalidation sits approximately 16.4% below the entry price.
- Setup Gamma: Invalidation sits approximately 24.3% below the entry price.
While the reward ratios remain uniform, the physical distance between being "in the trade" and being "wrong" varies dramatically. In professional trading, this distance dictates the size of the position.
Phase 3: Applying Fixed-Risk Mathematics
To maintain portfolio equilibrium, the trader must hold a single variable constant: the amount of hard capital at risk, rather than the arbitrary number of shares or coins purchased.
Assume a standard institutional risk parameter of a fixed 1% risk per trade on a $50,000 account. This means that regardless of the asset being traded, exactly $500 is on the line should the market hit the invalidation level.
With the monetary risk fixed at $500, the position size (total capital deployed into the asset) falls straight out of the mathematical equation:
-
Calculation for Setup Alpha (12.3% Stop):
$$textTotal Position Size = fractextCapital at RisktextStop Distance = frac$5000.123 approx $4,065 text of stock$$ -
Calculation for Setup Beta (16.4% Stop):
$$textTotal Position Size = frac$5000.164 approx $3,049 text of stock$$ -
Calculation for Setup Gamma (24.3% Stop):
$$textTotal Position Size = frac$5000.243 approx $2,058 text of stock$$
Phase 4: The Execution Trap
Notice the resulting dynamic: although the monetary risk is identical across all three positions ($500), the total capital deployed varies wildly. The largest position (Setup Alpha) is nearly double the size of the smallest position (Setup Gamma).
Many retail participants fall into the trap of buying three equal dollar chunks (e.g., $3,000 allocated to each trade). By doing so, they inadvertently make the trade with the widest, least-defined exit their largest risk exposure on the book. At equal sizing, a stop-loss set 24.3% away risks roughly double the capital of a stop set 12.3% away.
No professional intentionally doubles their risk profile on a volatile instrument. Yet, this dangerous exposure happens daily across global markets simply because traders skip the crucial step of calculating position size derived from stop distance.
Supporting Context & Metrics: Volatility as an Input, Not a Penalty
A persistent cognitive bias among developing market participants is the belief that a wide stop-loss represents a "bad trade." This misconception leads to flawed trading methodologies that ultimately impair long-term profitability.
The Misunderstanding of Volatility
In reality, a wide stop is not a reflection of poor trade quality. Different market structures, asset classes, and volatility regimes require varying amounts of breathing room. A high-beta growth stock or a volatile cryptocurrency inherently requires a wider invalidation threshold to avoid being shaken out by normal market noise before the primary trend resumes.
If the projected reward scales proportionally with that wider risk, the trade can be mathematically and fundamentally sound. Therefore, stop distance is not a quality score; it is a sizing input.
"Treating stop distance as a quality score causes traders to systematically avoid volatile instruments. Over time, this removes an entire category of large, trend-driven winners from your performance ledger."
The Psychology of the "Expensive Variant"
Even among traders who understand fixed-risk calculations, a psychological trap frequently emerges: the desire to "fix" what feels like an inadequate position size.
Consider the following behavioral sequence:
- The trader correctly sizes a high-volatility setup (Setup Gamma) using the mathematical formula, resulting in a modest capital allocation of roughly $2,058.
- The trade begins to progress, and the trader looks at the potential upside target. Because the stop is wide, the absolute price target is substantial.
- The trader experiences a psychological sense of being "short-changed." They look at the massive potential payout board and realize their position size is the smallest in their portfolio.
- Yielding to temptation, the trader "rounds up" the position size, injecting additional capital into the trade.
This maneuver completely invalidates the risk model. The large upside target is the direct mathematical justification for why the stop is wide. By using the reward potential to justify a larger position size, the trader is double-counting the exact variable that necessitated a small position in the first place.
If you want the trade, you must accept it in its proper proportion: You want that trade, and you want it small.
Expert Commentary & Analytical Insights
To contextualize these mathematical realities, leading market strategists and quantitative risk architects emphasize that capital preservation is an active, ongoing computational process rather than a passive defensive posture.
According to veteran portfolio risk managers, the primary failure mode of discretionary traders is starting their sizing equation from the wrong anchor point.
"When a trader starts their analysis from a round emotional number—such as ‘I want to put about three grand into this position’—they allow arbitrary psychology to dictate their risk parameters," notes a senior quantitative execution analyst. "You must work out the money at risk first, down to the penny, and only then calculate the number of shares or contracts. Never let a preferred capital allocation override your structural invalidation level."
Market veterans frequently challenge traders to audit their historical performance logs to confront these cognitive biases directly. An effective diagnostic exercise is to review the largest position held over the preceding trading month—not necessarily the most profitable one, but the one with the highest capital allocation.
When evaluating that position, traders must ask themselves a critical diagnostic question: Did that position earn its outsized capital allocation because of a tight, well-defined technical invalidation, or did it reach that size simply because the trader ‘liked it the most’?
In the heat of live execution, these two mental states feel identical at the exact moment the mouse button is clicked. Psychologically, high conviction and high structural risk merge into a single feeling of excitement. Mathematically, however, they are entirely different universes. One represents disciplined risk engineering; the other represents gambling disguised as analysis.
Future Outlook & Institutional Best Practices
As global financial markets become increasingly driven by algorithmic execution, high-frequency liquidity sweeps, and heightened macroeconomic volatility, the margin for error in position sizing is narrowing rapidly. Retail and institutional participants alike must adapt their operational frameworks to survive turbulent market cycles.
1. Automation of Risk-First Sizing
Future-facing trading desks are increasingly embedding strict mathematical guardrails directly into their order-routing software. Modern platforms are moving toward interfaces where traders cannot submit an order without first defining their invalidation price. The platform automatically calculates the maximum allowable share volume based on account equity and predefined risk percentages (e.g., 0.5% or 1.0%), effectively removing human emotion and the "rounding up" temptation from the execution pipeline.
2. Normalizing Volatility-Agnostic Portfolios
As institutional capital flows into diverse asset classes—bridging traditional equities, forex, commodities, and digital assets—portfolios must be constructed to handle vastly different volatility regimes. Moving forward, successful traders will be those who decouple asset volatility from asset quality. By treating wide stops as normal structural requirements for high-beta instruments and adjusting share size downward accordingly, traders can maintain stable equity curves even during periods of extreme market stress.
3. The Continuous Audit Standard
Risk management is not a static set of rules applied once; it is a continuous evolutionary feedback loop. Moving into the next fiscal period, professional development programs for traders will place heavier emphasis on post-trade analytics that isolate sizing errors from analytical errors. By systematically tracking whether losses stemmed from flawed market forecasting or undisciplined capital allocation, market participants can refine their execution mechanics and protect their longevity in the markets.
Conclusion
Trading success is ultimately an exercise in disciplined arithmetic. The illusion that all technical setups of equal reward-to-risk ratios should command equal capital allocation is a persistent trap that separates profitable operators from perpetual accounts-in-recovery.
By anchoring position size strictly to the distance of the invalidation level—and resisting the psychological impulse to override these calculations for the sake of larger nominal returns—traders can achieve true portfolio symmetry. Remember the golden rule of professional risk engineering: Work out the money first, calculate the shares second, and never let emotion distort the mathematics of survival.
Disclaimer: The information, analysis, and publications provided herein are for educational and informational purposes only and do not constitute financial, investment, trading, or professional advice. Trading financial instruments carries a high level of risk and may not be suitable for all investors. Readers should conduct thorough independent research and consult with a licensed financial advisor before deploying capital into the markets.