Executive Overview
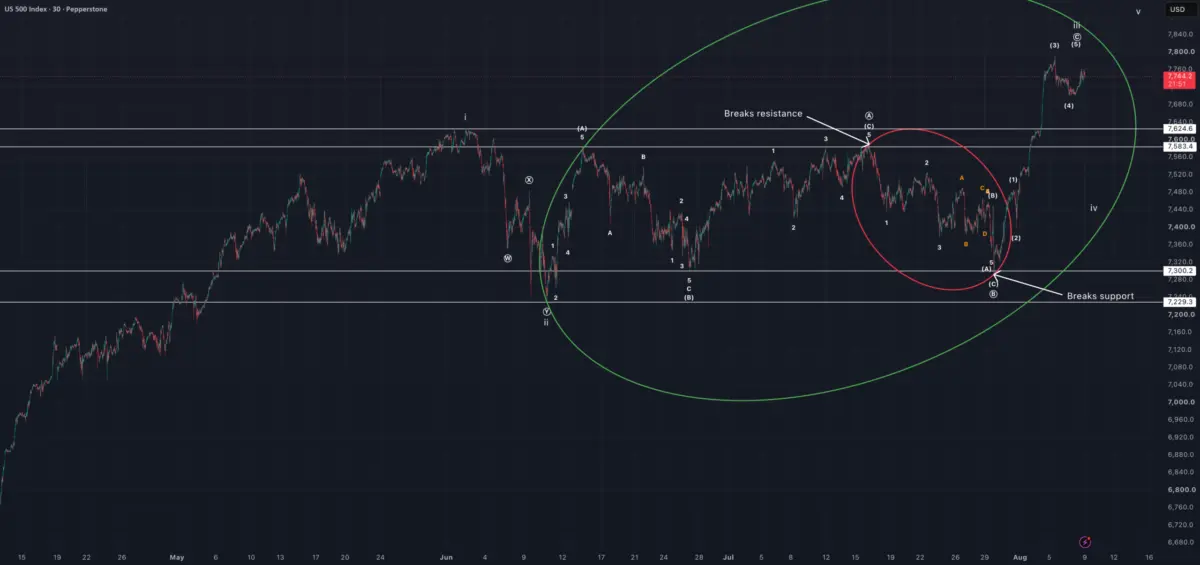
Recent price action residing between the critical boundaries of 7624.6 and 7229.3 has presented a formidable puzzle for technical analysts. Characterized by choppy, overlapping waves and ambiguous internal structures, this trading range has defied straightforward categorization. According to detailed market commentary published by analyst discobiscuit on TradingView, this zone has been marked by three distinct diagonals, challenging traditional wave-counting methodologies and forcing market observers to weigh multiple Elliott Wave scenarios.
At the heart of the current debate is a specific price region highlighted within a red ellipse on the analyst’s charts. For the bullish camp to maintain control and validate a completed expanded flat pattern, this pivotal segment must resolve as an impulse wave C. However, structural anomalies within the price action complicate this interpretation. While a diagonal is indeed embedded within this movement, it appears to function as wave A of a standard A-B-C zigzag correction rather than the final leg of an impulsive sequence.
This analytical nuance carries profound implications for the broader market structure. If the price action encapsulated by the red ellipse fails to qualify as a genuine C wave, the entire pattern—encompassed within a larger green ellipse—must be reclassified as corrective rather than impulsive. Such a shift opens the door to the formation of a larger-degree diagonal, signaling a potential paradigm shift in the prevailing trend.
As market participants monitor these developments, critical price boundaries have emerged as the ultimate arbiters of near-term direction. The 7624.6 level stands as the immediate line in the sand for bullish momentum. As long as prices hold above this threshold, the broader upward structure remains intact. However, a breach below 7624.6—provided it holds above the secondary floor of 7229.3—would introduce the distinct possibility of a developing wave 4, heightening the probability of a macro-diagonal unfolding. This report provides an exhaustive, multi-faceted exploration of these technical dynamics, breaking down the chronology of price action, the underlying metrics, alternative theoretical frameworks, and the strategic outlook for market participants.
Detailed Chronology of Recent Price Action
To fully comprehend the gravity of the current technical setup, one must trace the chronological evolution of price behavior leading into and out of the 7624.6–7229.3 range. Market structure does not form in a vacuum; it is the cumulative result of historical buying and selling pressure, emotional extremes, and liquidity shifts across multiple timeframes.
The Buildup and Entry into the Range
Prior to entering the choppy consolidation zone between 7624.6 and 7229.3, the asset in question exhibited strong directional momentum. Impulsive advances typically draw in trend-following capital, driving valuations higher until exhaustion sets in. As the market approached its recent local highs, the character of the price action began to shift noticeably. Candlesticks overlapped significantly, momentum indicators showed signs of bearish divergence, and volume profiles flattened—classic precursors to a corrective or transitional phase.
As the market rolled over from its highs, it entered the contested zone, giving rise to the first major analytical challenge: a sequence of overlapping price swings that technical observers identified as a series of three diagonals. Diagonals, by definition in Elliott Wave theory, are wedge-shaped patterns that indicate exhaustion of a move or a powerful transition. The appearance of multiple diagonals in close proximity is rare and typically signals high market indecision, where neither buyers nor sellers can establish sustained dominance.
The Red Ellipse: The Crux of the Bullish Argument
Within this messy middle ground, attention quickly shifted to the specific price movement highlighted by the red ellipse. In Elliott Wave analysis, identifying the nature of a wave within a correction dictates the validity of the overarching pattern. For bullish analysts advocating for an expanded flat completion, this segment of price action must act as an impulse wave C.
An expanded flat is a common three-wave correction where wave B exceeds the origin of wave A, and wave C travels beyond the termination of wave A. For this pattern to successfully conclude and clear the path for a powerful continuation of the primary trend, wave C must display impulsive internal characteristics—sub-divided into a clear 1-2-3-4-5 structure.
However, a granular examination of the price action within the red ellipse reveals a structural conflict. While a wedge or diagonal pattern is visibly forming, its internal mechanics suggest it behaves as wave A of a larger A-B-C zigzag rather than the final thrust of an impulse wave. If true, this invalidates the expanded flat hypothesis, pulling the rug out from under the immediate bullish narrative and forcing a re-evaluation of the entire sequence.
The Green Ellipse: The Corrective Reclassification
The broader structural implication of a failed C-wave hypothesis is captured within the green ellipse. If the price action within the red zone is proven to be corrective rather than impulsive, the entire complex structure encompassing both ellipses must be reinterpreted.
Instead of acting as a launching pad for a new impulsive advance, the entire formation represents a prolonged, complex correction. In technical analysis, corrective structures of this magnitude often precede structural transitions of a larger degree. Specifically, it points toward the formation of a leading or ending diagonal on a higher timeframe, characterized by contracting trendlines and deep, overlapping corrective waves.
Supporting Context & Metrics: Decoding the Elliott Wave Framework
To appreciate the weight of these technical observations, one must examine the foundational mechanics of Elliott Wave Theory, trendline analysis, and the psychological interplay driving market participants at these specific levels.
The Mechanics of Diagonals and Expanded Flats
Elliott Wave Theory, originally developed by Ralph Nelson Elliott in the 1930s, posits that financial markets move in repetitive cycles driven by collective investor psychology. These cycles are categorized into impulses (trend-推动 waves) and corrections (counter-trend waves).
- Diagonals (Wedges): Unlike standard impulse waves where wave 4 does not overlap the price territory of wave 1, diagonals feature overlapping waves. They typically appear in the wedge position—either as a terminating wave 5 or as a wave A/1 in a turning point. The presence of three diagonals in a relatively tight range (between 7624.6 and 7229.3) underscores a market caught in a state of extreme compression and structural transition.
- Expanded Flats: An expanded (or running) flat is a sideways correction consisting of a 3-3-5 wave structure. Wave A is a zigzag, wave B is a deeper retracement that breaks the origin of wave A, and wave C is a strong impulse that pushes significantly beyond the end of wave A. The psychological driver behind an expanded flat is a sudden surge of aggressive counter-trend positioning that traps breakout traders before the primary trend violently resumes.
Key Price Thresholds and Risk Parameters
Technical analysis is ultimately about risk management and probability assessment. The analysis provided by discobiscuit establishes clear numerical guardrails that dictate market bias:
- The 7624.6 Level (The Bullish Line in the Sand): This metric serves as the immediate threshold for trend continuation. As long as price action respects this boundary on a closing basis, bulls retain structural control. A defense of 7624.6 implies that the recent choppiness is merely consolidation within a broader bullish framework.
- The 7229.3 Level (The Structural Floor): Serving as the lower boundary of the recent choppy range, 7229.3 represents a critical support zone. Should prices breach 7624.6 but hold above 7229.3, the market enters a secondary analytical phase—one where wave 4 takes shape and the probability of a large-degree diagonal increases significantly.
- The Breach Scenario: A decisive breakdown below 7229.3 would invalidate the bullish consolidation thesis altogether, signaling that the corrective structures within the green and red ellipses are precursors to a much deeper retracement or a macro-trend reversal.
Official Statements and Market Commentary
While individual technical analysts operate independently on platforms like TradingView, their insights contribute to a wider ecosystem of market discourse. The observations shared by discobiscuit reflect a growing sentiment of cautious vigilance among independent chartists navigating choppy asset classes.
The Analyst’s Perspective: Nuance Over Dogma
A defining characteristic of professional technical analysis is the ability to adapt to conflicting signals rather than forcing price action to fit a rigid template. The commentary highlights a willingness to question initial assumptions:
"I think the key area, though, is what’s encircled in the red ellipse. Bulls need that to be an impulse C to complete an expanded flat, and I just don’t see how to make it a diagonal. There is a diagonal in it, but it’s a diagonal A of an ABC zigzag."
This candid assessment underscores the core challenge facing market participants: distinguishing between high-probability impulse formations and deceptive corrective sub-waves. By transparently outlining the conditions under which the bullish thesis holds versus the conditions that trigger a structural pivot, the commentary provides a masterclass in conditional trading strategy.
Platform Disclaimer and Ethical Framework
It is essential to contextualize these analyses within the standard regulatory and platform frameworks governing financial publishing. As explicitly noted by TradingView:
The information and publications are not meant to be, and do not constitute, financial, investment, trading, or other types of advice or recommendations supplied or endorsed by TradingView.
Technical analysis offers probabilistic roadmaps rather than absolute certainties. Independent insights serve as educational tools and analytical frameworks to assist traders in formulating their own risk-management strategies, rather than serving as direct directives for capital allocation.
Future Outlook: Scenarios for the Trading Horizon
As the market continues to digest the price action between 7624.6 and 7229.3, participants must prepare for multiple potential trajectories. Based on the structural interpretations detailed above, three primary scenarios emerge for the medium-term outlook.
Scenario A: The Bullish Resolution (The Expanded Flat Success)
- Conditions: Price action successfully defends the 7624.6 support level, and momentum indicators begin to point upward with expanding volume.
- Structural Outcome: The movement within the red ellipse is re-evaluated or accepts a localized interpretation as an impulsive C wave completing an expanded flat.
- Market Implication: The correction is officially deemed complete. The asset prepares to embark on a powerful impulsive rally, targeting previous highs and initiating a new leg of the primary bull market.
Scenario B: The Wave 4 Consolidation & Macro-Diagonal Development
- Conditions: Price breaks below the immediate threshold of 7624.6 but finds firm support before breaching 7229.3.
- Structural Outcome: The pattern within the red ellipse is confirmed as corrective (wave A of an A-B-C zigzag), invalidating the immediate expanded flat. The broader structure in the green ellipse is classified as a developing wave 4.
- Market Implication: Volatility remains elevated. The market enters a protracted sideways or contracting phase, building a large-degree diagonal. Traders must adopt a range-bound strategy, buying near the 7229.3 floor and trimming exposure as prices approach upper resistance bands.
Scenario C: Bearish Breakdown and Structural Invalidation
- Conditions: Sustained selling pressure drives prices decisively below the 7229.3 support level on high volume.
- Structural Outcome: All bullish corrective structures fail. The entire sequence is exposed as a top-heavy distribution pattern preceding a major trend reversal.
- Market Implication: Risk-off protocols are triggered. Capital flees the asset class, and market participants shift focus to lower support tiers as a deeper bearish cycle unfolds.
Conclusion
The current technical landscape defined by the 7624.6 to 7229.3 price channel serves as a poignant reminder of the complexities inherent in financial markets. Through rigorous Elliott Wave interpretation, analysts like discobiscuit demonstrate that surface-level price movements often mask deep structural debates.
Whether the market ultimately validates the bullish expanded flat scenario, transitions into a complex wave 4 large-degree diagonal, or succumbs to a bearish breakdown will be determined by how price action reacts to these critical numerical thresholds in the sessions ahead. For disciplined traders and investors, success in this environment relies not on predicting the future with absolute certainty, but on monitoring these key levels, respecting risk parameters, and remaining adaptable as the market reveals its true intentions.