rifanmuazin is a reporter for DeBitcoin covering Crypto Market Analysis. She/He is based in Indonesia.
10 August 2026 • 8 min read
Capital markets are bracing for a decisive macroeconomic juncture as digital assets and crypto-adjacent equities undergo a pronounced preemptive rally ahead of the upcoming U.S. Consumer Price Index (CPI) release. Circle Stock (CRCL) surged 5.36% during regular trading sessions to hit $68.18, before extending its upward trajectory in pre-market action. Concurrently, Bitcoin (BTC) reclaimed the $65,000 threshold, signaling a broader institutional appetite for risk assets amid recalibrated monetary policy expectations.
Executive Overview
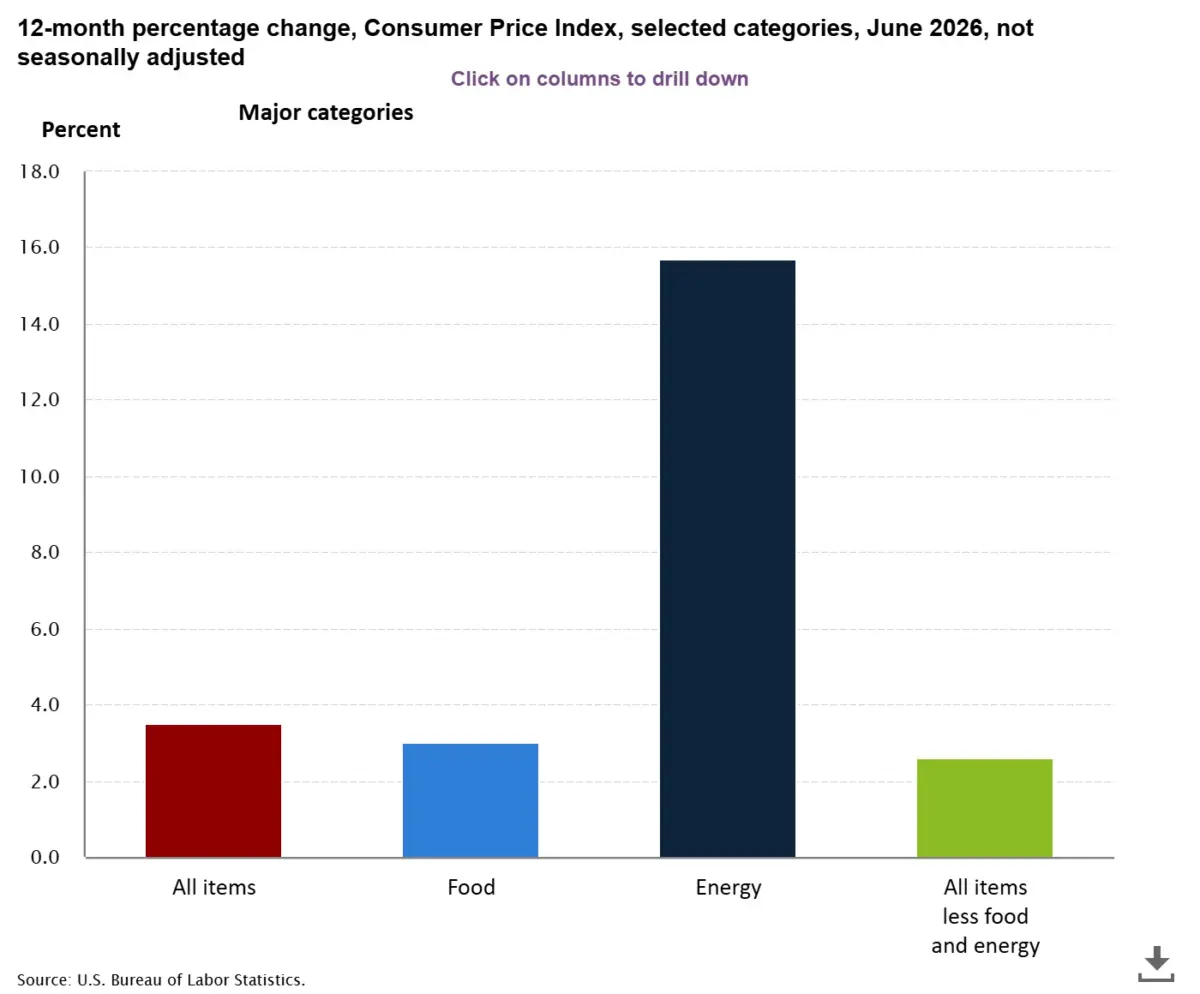
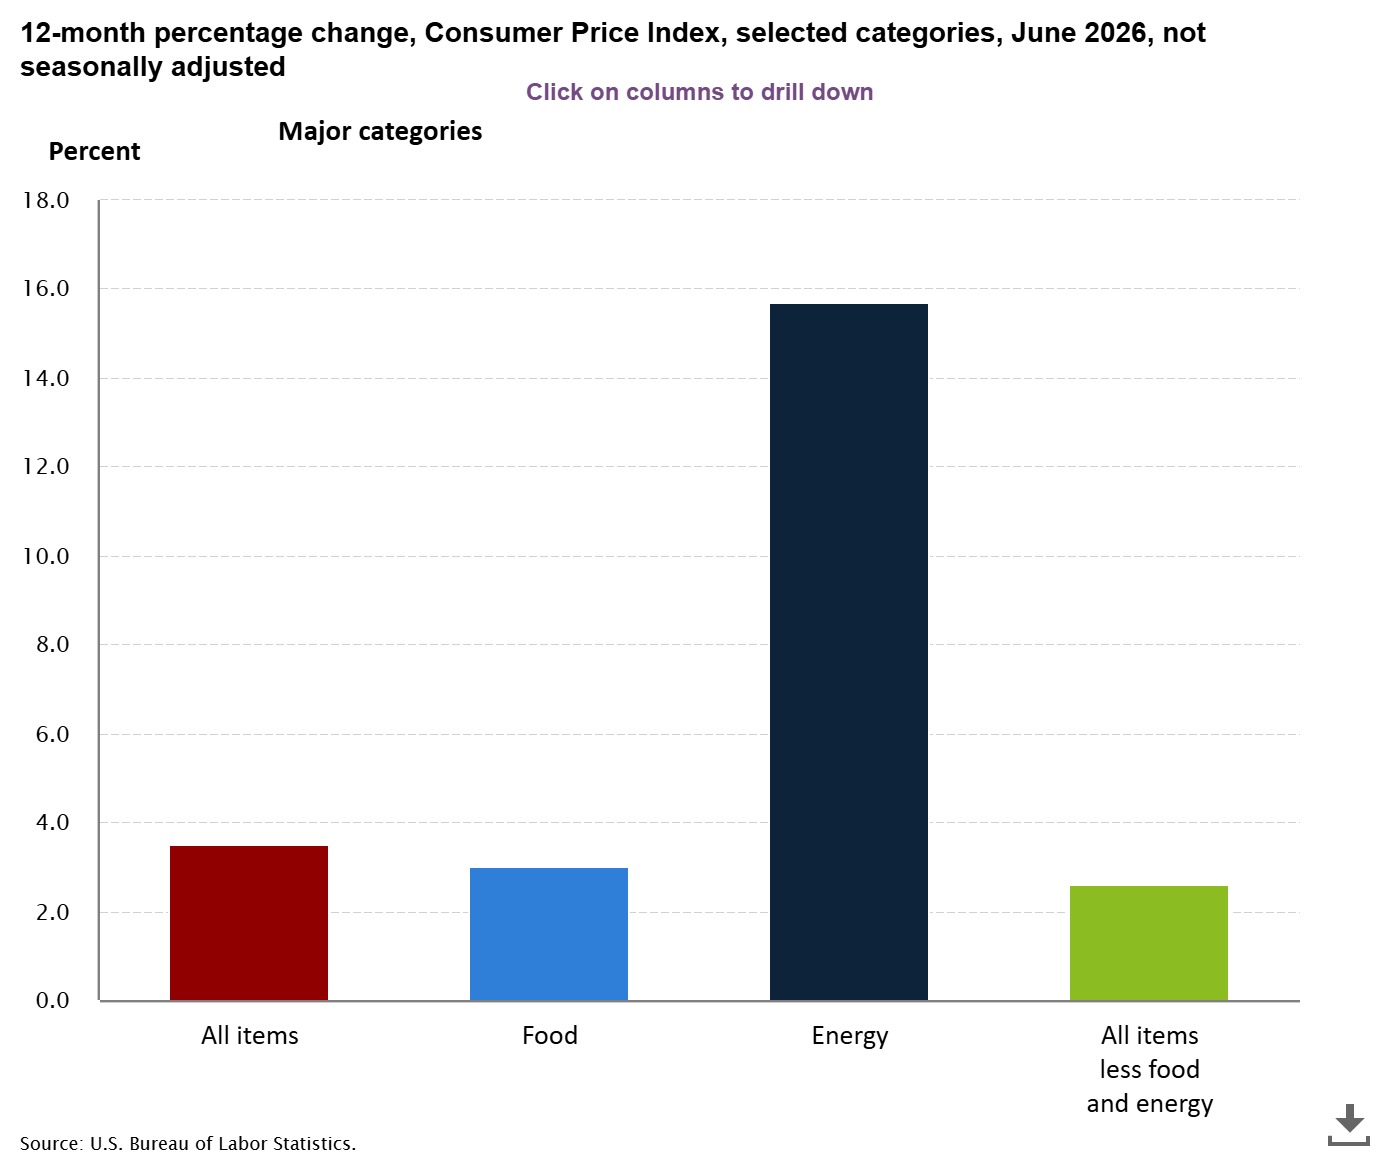
This synchronized advance comes as market participants re-evaluate the trajectory of Federal Reserve interest rate policy in light of softening economic indicators. With headline annual inflation projected to moderate to 3.4%, investors are positioning for a potential pivot toward monetary easing. However, this bullish momentum remains delicately poised. The financial landscape faces a packed week of macroeconomic catalysts—spanning labor statistics, producer price metrics, housing data, and consumer sentiment figures—each capable of drastically altering the rate-cut narrative and triggering renewed market volatility.
The momentum observed across risk assets unfolded through a series of key market moves leading up to the critical inflation report scheduled for publication by the U.S. Bureau of Labor Statistics (BLS) on Wednesday, August 12, at 8:30 a.m. Eastern Time.
   MONDAY, AUG 10                  TUESDAY, AUG 11               WEDNESDAY, AUG 12
+--------------------+          +--------------------+        +--------------------+
| • CRCL surges 5.36%|  ======> | • Existing Home    | =====> | • U.S. CPI Release |
|   to $68.18        |          |   Sales Data       |        |   (8:30 AM ET)     |
| • BTC breaks $65k  |          | • Housing demand   |        | • Target: 3.4% YoY |
| • Pre-market +3%   |          |   gauged           |        | • Major volatility |
+--------------------+          +--------------------+        +--------------------+
                                                                        ||
                                                                        /
   FRIDAY, AUG 14                  THURSDAY, AUG 13
+--------------------+          +--------------------+
| • Retail Sales     | <======  | • Producer Price   |
| • UMich Consumer   |          |   Index (PPI)      |
|   Sentiment Data   |          | • Jobless Claims   |
+--------------------+          +--------------------+
Phase 1: The Initial Surge (Monday, August 10)
During Monday’s session, Circle Stock experienced an influx of buying volume, closing up 5.36% at $68.18. The buying momentum persisted after hours, pushing the stock up an additional $1.49 (or roughly 3%) in pre-market trading. Concurrently, Bitcoin cleared key psychological resistance at $65,000, driven by spot market demand and positive institutional order flow across major derivative venues.
Phase 2: Housing and Credit Signals (Tuesday, August 11)
Market focus briefly pivoted to the release of Existing Home Sales data. The print offered an empirical look into the real estate sector, revealing how high mortgage rates continue to dampen buyer activity. A soft housing figure reinforced the narrative that restrictive monetary policy is weighing on the broader economic expansion.
Phase 3: The Macro Benchmark (Wednesday, August 12)
The focal point of the week remains the U.S. CPI release. Financial markets are pricing in an annual headline inflation rate of 3.4%. A print aligned with or below this expectation is widely anticipated to validate bets on a Fed rate cut in the second half of the year, providing further tailwinds for non-yielding and growth-oriented assets.
Phase 4: Wholesale Inflation and Labor Pressure (Thursday, August 13)
Attention will pivot to the Producer Price Index (PPI) alongside the latest Initial Jobless Claims figures. While CPI captures consumer-facing price pressures, the PPI measures input costs for domestic producers, serving as a leading indicator for supply chain pressures and corporate profit margins.
Phase 5: Consumption and Consumer Sentiment (Friday, August 14)
The week concludes with Retail Sales figures and the preliminary University of Michigan Consumer Sentiment Index. These metrics will offer critical insight into consumer spending health and long-term inflation expectations, establishing the fundamental tone for financial markets heading into the end of the month.
Supporting Context & Macroeconomic Metrics
The convergence of equities and digital assets during this pre-CPI window highlights a deeper structural shift in macro sentiment. The financial backdrop is defined by mixed economic data: while inflation is cooling toward target levels, the U.S. labor market is showing early signs of softening.
The market’s growing expectation of a Federal Reserve monetary pivot is largely anchored in recent labor data:
Nonfarm Payrolls: The U.S. economy unexpectedly shed 23,000 nonfarm jobs in July, falling significantly short of consensus expectations.
Historical Downward Revisions: The Bureau of Labor Statistics significantly revised previous metrics, reducing May payroll gains by 66,000 and June gains by 37,000. These adjustments effectively erased 103,000 previously reported jobs from the official tally.
Unemployment Rate: The nationwide unemployment rate rose to 4.1%, signaling a gradual loosening of labor conditions.
Wage Growth Dynamics: Average hourly earnings grew at an annualized rate of 3.2%. While this represents a moderation from peak inflationary periods, sustained wage increases present a sticky underlying variable for monetary policymakers.
2. The Interplay Between Inflation and Risk Capital
Monetary policy transmission works directly through the discount rate applied to future cash flows and the opportunity cost of holding non-yielding digital assets:
The Soft Landing Scenario (CPI ≤ 3.4%): A decelerating inflation print gives the Federal Reserve operational room to cut benchmark rates without risking a secondary spike in consumer prices. Lower borrowing costs lower capital expenditure hurdles for financial technologies while expanding liquidity across crypto markets.
The Sticky Inflation Scenario (CPI > 3.4%): An upside inflation surprise could force the Federal Reserve to maintain a "higher-for-longer" monetary stance. Elevated yield environments typically suppress equity valuations and trigger capital flights from volatile assets like Bitcoin into fixed-income securities.
Market Sentiment and Policy Analysis
Financial analysts and institutional strategists are carefully evaluating the Fed’s dual mandate—balancing price stability against maximum sustainable employment.
In a market commentary widely circulated on social media, market research firm Bull Theory emphasized the significance of this week’s sequential data points for Federal Reserve decision-making:
"The Fed is about to get the data it needs this week: First, Existing Home Sales offer a key read on housing demand under high borrowing costs. Second, Wednesday’s CPI report serves as the paramount macroeconomic catalyst. A softer print opens the door for systematic policy easing, while an elevated reading complicates the path forward."
Institutional equity analysts also note that Circle’s market capitalization remains closely linked to short-term interest rates. As the issuer of the USDC stablecoin, Circle derives a significant portion of its income from yield generated on reserve assets, such as short-dated U.S. Treasuries. Consequently, market moves in CRCL stock reflect a balance between higher trading volumes during risk-on environments and shifting yield margins in a lower-rate regime.
Technical Analysis & Price Outlook
Circle Stock (CRCL): Technical Breakdown
Circle Stock’s recent price action shows a technical recovery from its recent local lows, though it approaches significant overhead supply zones.
Immediate Resistance: The stock faces immediate chart resistance near $68.50. A high-volume breakout above this level could clear the path toward $70.00.
Secondary Target: Sustained buying momentum post-CPI could push CRCL toward the $72.00 price target, marking a complete retracement of its recent correction.
Bearish Scenario Parameters
Key Support Pivot: To maintain its short-term bullish structure, CRCL must defend the $67.50 level.
Downside Targets: A breakdown below $67.50 would expose the stock to secondary support around $65.00. Should inflation surprise to the upside and trigger broader market selling, the stock could test lower structural support near $63.28.
+-----------------------------------------------------------------------+
|                    CRCL STOCK TECHNICAL SUMMARY                       |
+-------------------+------------------+--------------------------------+
| Key Level Type    | Price Level      | Market Significance            |
+-------------------+------------------+--------------------------------+
| Major Resistance  | $72.00           | Target for extended breakout   |
| Immediate Hurdle  | $68.50           | Must breach for further upside |
| Short-Term Pivot  | $67.50           | Must hold to sustain structure |
| Primary Support   | $65.00           | Key buyer re-entry zone        |
| Major Risk Target | $63.28           | Downside support on hot CPI    |
+-------------------+------------------+--------------------------------+
Bitcoin (BTC) & Digital Asset Market Dynamics
Bitcoin’s push above $65,000 aligns with a broader recovery in spot market liquidity.
Dovish CPI Case: If CPI prints at or below 3.4%, Bitcoin could extend its rally toward upper resistance bands near $68,000–$70,000, as institutional investors price in lower real yields and expanding fiat liquidity.
Hawkish CPI Case: Conversely, an unexpected tick upward in CPI could spark liquidations across leveraged long positions, potentially driving BTC back down to test primary demand zones around $62,000 and $60,000.
Future Outlook
The trajectory for both Circle Stock and the broader digital asset market over the coming quarter depends on the macroeconomic environment. While a cooling labor market and moderating inflation support the narrative for a dovish monetary policy pivot, persistent wage growth and underlying services inflation remain key factors to monitor.
Investors will closely analyze the Federal Reserve’s upcoming policy decisions alongside incoming economic indicators. If the CPI report confirms a sustained trend toward the Fed’s 2% target, the current risk-on environment could mature into a broader structural rally across growth equities and digital assets heading into the final quarters of the year.