Executive Overview
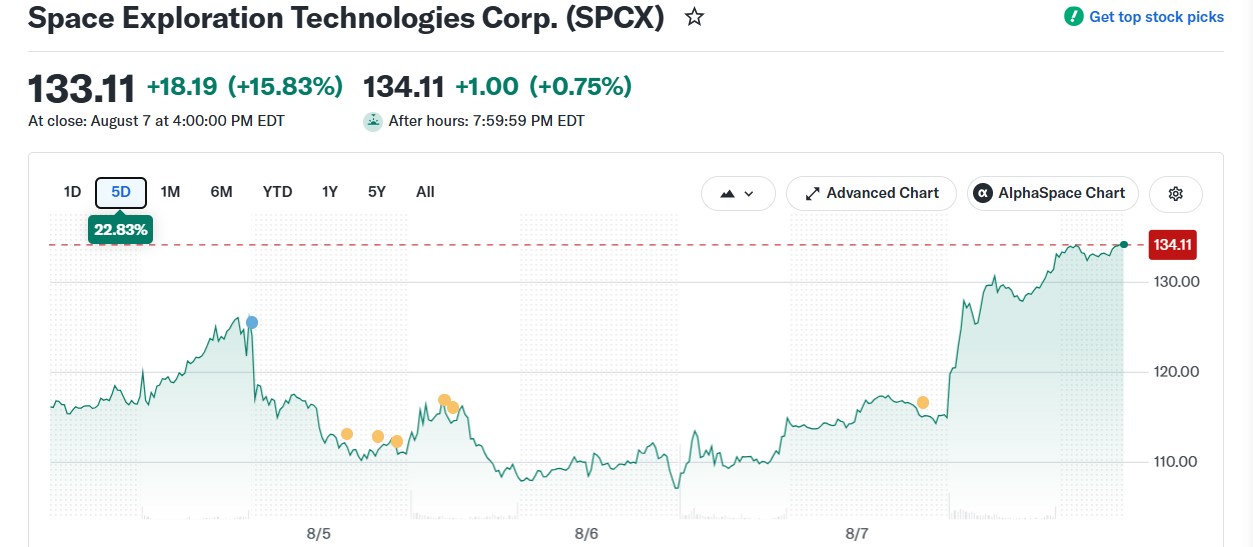
The rally unfolded against a backdrop that financial theory dictates should have produced severe downward pressure: the simultaneous release of 911.5 million previously restricted shares into the tradable float. Typically, the expiration of an insider lockup period introduces a flood of supply, diluting market liquidity and prompting institutional sell-offs. Instead, SpaceX experienced an influx of buy-side demand that fully absorbed the newly unlocked float, propelling the equity past its mega-cap peers and outperforming every company among the top ten global entities by market capitalization over the same timeframe.
SPCX Price Trajectory & Key Catalysts (August 3–7, 2026)
----------------------------------------------------------------------------------
Date        Price Level   Key Driver / Market Event
----------------------------------------------------------------------------------
Aug 3       ~$109.00      Pre-earnings consolidation & lockup anxiety
Aug 4       ~$118.00      Q2 2026 Earnings beat ($7.81B rev vs $6.90B est)
Aug 6       $106.00       All-Time Low hit during 911.5M share unlock release
Aug 7       $133.00       15% single-day surge driven by US Jobs Report (-23k payrolls)
----------------------------------------------------------------------------------
The mechanics behind this market-defying movement rest upon three primary pillars:
- A blow-out Q2 2026 financial report featuring a 92% year-over-year revenue expansion,
- Unprecedented secondary market trading volume signaling structural institutional accumulation, and
- A favorable shift in macroeconomic conditions catalyzed by cooling U.S. labor market data, which recalibrated Federal Reserve interest rate projections.
With shares sitting just 1.5% below their $135 IPO price, Wall Street is re-evaluating SpaceX’s near-term valuation trajectory and its long-term cost-of-capital advantages.
Detailed Chronology
The sequence of events leading to SpaceX’s market recovery illustrates a rapid transition from bearish sentiment to aggressive capital deployment over five key trading days in August 2026.
+-----------------------------------------------------------------------------------+
|                        CHRONOLOGY OF EVENTS (AUG 3 - AUG 7)                      |
+-----------------------------------------------------------------------------------+
|  AUG 3: Pre-Earnings Tension                                                      |
|  - Stock trades under pressure near $109 amid fears of massive insider unlock.    |
+-----------------------------------------------------------------------------------+
                                         |
                                         v
+-----------------------------------------------------------------------------------+
|  AUG 4: Financial Shockwave                                                       |
|  - Q2 Revenue hits $7.81B (Beating $6.9B consensus by 13.2%).                     |
|  - Volume spikes to 144 million shares as buyers enter.                           |
+-----------------------------------------------------------------------------------+
                                         |
                                         v
+-----------------------------------------------------------------------------------+
|  AUG 6: The Lockup Floor Test                                                     |
|  - 911.5M shares become eligible for sale.                                        |
|  - Stock hits all-time low of $106 before massive institutional absorption.       |
|  - Daily trading volume peaks at a record 255 million shares.                     |
+-----------------------------------------------------------------------------------+
                                         |
                                         v
+-----------------------------------------------------------------------------------+
|  AUG 7: The Macro Spark & Rally Close                                             |
|  - US Payrolls drop by 23k (vs. +80k expected), signaling Fed pause/rate cuts.    |
|  - SPCX surges 15% in a single session to close at $133 (1.5% shy of $135 IPO).   |
+-----------------------------------------------------------------------------------+
August 3, 2026: Pre-Earnings Consolidation
Trading opened under a cloud of caution as institutional desks prepared for the impending expiration of the post-IPO lockup agreement. Market participants anticipated that early employees, venture capital funds, and strategic insiders would liquidate portions of their holdings, leading to short positioning and downward drift in the equity toward the sub-$110 range.
August 4, 2026: The Financial Catalyst
SpaceX released its second-quarter 2026 earnings statement after the market close, delivering financial metrics that shattered Wall Street consensus. Trading volume abruptly surged to 144 million shares—roughly three times its pre-earnings baseline—as high-frequency strategies and fundamental institutional accounts rushed to adjust their models in light of accelerating top-line expansion.
August 6, 2026: Lockup Expiration and Floor Discovery
The critical stress test occurred on August 6, when 911.5 million shares officially became eligible for public sale. In early trading, short sellers and risk-averse accounts pushed SPCX down to an all-time low of $106. However, rather than triggering a cascade of stop-loss orders, the price action attracted institutional buyers waiting to absorb the float.
Trading volume hit a record 255 million shares on the day. The complete absorption of available supply at the $106 level established a definitive valuation floor, setting the stage for a short squeeze and momentum reversal.
August 7, 2026: Macro Tailwinds and the 15% Surge
The macroeconomic catalyst arrived on the morning of August 7 with the release of the U.S. Bureau of Labor Statistics nonfarm payrolls report. The unexpected contraction in employment figures triggered a sharp rally across high-growth equity sectors.

SPCX experienced an aggressive upside acceleration, gaining 15% within normal market hours to close at $133 per share. This capstone rally closed the week up 22% from its August 3 baseline, positioning the stock within touching distance of its $135 debut price.
Supporting Context & Metrics
Operational & Financial Performance
SpaceX’s operational metrics for Q2 2026 provided the fundamental backing necessary to digest the float expansion. The company reported quarterly top-line revenue of $7.81 billion, outpacing Wall Street’s consensus estimate of $6.90 billion by 13.2%.
Compared to the $4.10 billion top-line figure generated in Q2 2025, this performance represents a 92% year-over-year growth rate. This acceleration was driven by expanded commercial launch Cadences and scaling subscription revenues within its satellite broadband ecosystem.
SpaceX Q2 Financial Performance Comparison (2025 vs. 2026)
+-------------------------------------------------------------------+
| Metric                   | Q2 2025      | Q2 2026      | YoY Change|
+-------------------------------------------------------------------+
| Total Revenue            | $4.10 Billion| $7.81 Billion| +92.0%    |
| Wall Street Consensus    | N/A          | $6.90 Billion| +13.2%*   |
| Daily Vol. (Peak/Unlock) | ~40-50M      | 255 Million  | +410.0%   |
+-------------------------------------------------------------------+
*Represents beat percentage over consensus estimates.
Liquidity and Trading Volume Dynamics
The liquidity profiles observed between August 4 and August 7 highlight structural institutional demand. Prior to the Q2 earnings release, daily volume averaged under 50 million shares. Following the earnings print:
- Volume expanded to 144 million shares on August 4.
- Volume surged further to 255 million shares on August 6—the day of the 911.5 million share unlock.
This volume profile indicates that institutional market participants utilized the liquidity provided by the lockup expiration to build long-term positions without driving execution slippage excessively higher.
Volume Dynamics Around Earnings & Unlock Events
+------------------------------------------------------------------+
| Date           | Event Description           | Share Volume      |
+------------------------------------------------------------------+
| Pre-Aug 4      | Baseline Trading Average    | ~45,000,000       |
| Aug 4, 2026    | Q2 Earnings Announcement    | 144,000,000       |
| Aug 6, 2026    | 911.5M Share Lockup Expiry  | 255,000,000       |
+------------------------------------------------------------------+
Macroeconomic Shift: Labor Data and Federal Reserve Outlook
The broader macroeconomic climate shifted on August 7 following the publication of the July 2026 U.S. Jobs Report. Nonfarm payrolls unexpectedly dropped by 23,000, contrasting sharply with the 80,000 job additions anticipated by economists.
Macroeconomic Summary: July 2026 U.S. Nonfarm Payrolls
+------------------------------------------------------------------+
| Parameter                   | Consensus Est.  | Actual Reported  |
+------------------------------------------------------------------+
| Nonfarm Payroll Additions   | +80,000         | -23,000          |
| Market Impact               | Hawkish Bias    | Dovish Pivot     |
| Sept 2026 FOMC Rate Pause   | ~35% Likelihood | 66% Likelihood   |
+------------------------------------------------------------------+
This contraction signaled a softening labor market, prompting money markets to reprice the Federal Reserve’s monetary policy path. According to interest rate prediction markets, the probability of the Federal Open Market Committee (FOMC) maintaining or reducing interest rates at its September 2026 meeting jumped to 66%.
For growth equities like SpaceX—whose intrinsic valuations rely heavily on discounted future cash flow models—a lower interest rate environment compresses discount rates, directly increasing net present valuation figures.
Official Statements & Expert Commentary
The divergence between market expectations and SPCX’s actual price path generated significant commentary across institutional equity research desks and independent market analysts.
Market analyst Nic Cruz emphasized that short sellers miscalculated the willingness of insiders to liquidate at prevailing price levels:
"Many people were betting against insiders and employees selling their shares, but the complete opposite happened, as expected. The market prepared for a massive selloff, but institutional order flow stepped in to absorb every available tranche of stock. The volume numbers, reaching 255 million shares on the unlock date, demonstrate that insider supply was met with an even larger wave of institutional buy-side demand."
Equity research firms quickly updated their models following the Q2 report and successful lockup absorption:
- Argus Research: Upgraded SpaceX from a "Hold" rating to a "Buy," setting an initial price target of $160. The firm cited top-line revenue velocity, scaling unit economics in commercial launches, and the elimination of lockup overhang risk as core investment catalysts.
- Morgan Stanley: Reaffirmed its overweight stance on SPCX, maintaining a long-term price target of $300. The investment bank noted that SpaceX’s vertical integration and expanding constellation footprint provide durable competitive moats that justify premium valuation multiples relative to legacy aerospace and defense primes.
Future Outlook & Technical Analysis
Technical Chart Setup: Rounded Bottom Reversal
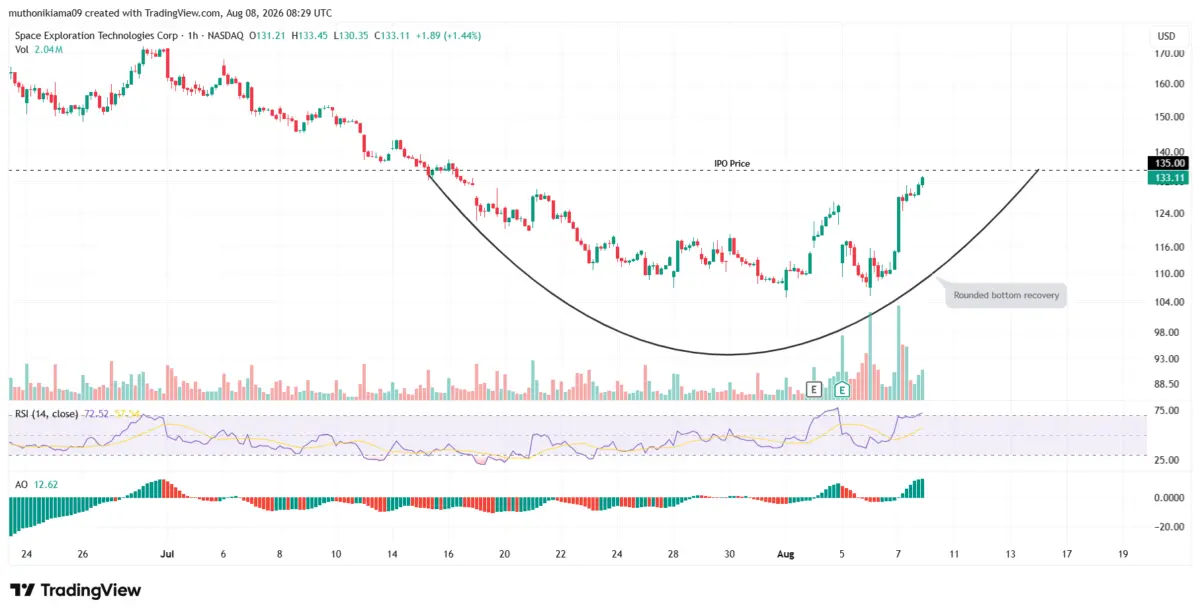
From a technical chart perspective, SPCX’s one-hour price action displays a defined rounded bottom pattern spanning the period from August 3 through August 7. This classical chart structure typically indicates a transition from an established downward trend to an emerging accumulation phase.
SPCX One-Hour Technical Overview
----------------------------------------------------------------------------------
Indicator / Pattern     Reading / Setup             Technical Implications
----------------------------------------------------------------------------------
Pattern Formed          Rounded Bottom              Structural trend reversal (Downtrend -> Uptrend)
Relative Strength Index 72.00                       Strong bullish momentum; near overbought
Awesome Oscillator      Rising Green Histogram      Sustained buyer control above zero line
Primary Resistance      $135.00                     IPO reference price & break-even wall
Upside Target           $150.00                     Psychological resistance upon $135 break
Support Floor           $105.00 – $106.00           August 6 all-time low / lockup floor
----------------------------------------------------------------------------------- Relative Strength Index (RSI): The hourly RSI currently stands at 72. While this reading enters overbought territory, it reflects momentum buying following the earnings beat and macro shift.
- Awesome Oscillator (AO): The AO histogram continues to print green bars expanding in height above the zero line, confirming strong bullish momentum and active buyer control.
               [SPCX Technical Resistance & Support Levels]

  $150.00 +------------------------------------------------- [Target Level]
          |
  $135.00 +------------------------------------------------- [Key Resistance / IPO Price]
          |                                  /---
  $133.00 +---------------------------------/-------------- [Current Price: Aug 7 Close]
          |                         /------/
          |                  /-----/
  $106.00 +-----------------+------------------------------- [Support Floor / Aug 6 Low]
          +-------------------------------------------------
            Aug 3        Aug 4        Aug 6        Aug 7
Key Price Levels and Execution Scenarios
Market participants are monitoring several technical and psychological price zones as the stock approaches its debut price:
1. The $135 Resistance Overhead
The $135 level represents SpaceX’s initial public offering price. This zone serves as a significant structural hurdle because retail and institutional participants who purchased during the IPO reach break-even at this threshold. A wave of break-even selling could generate transient overhead supply.
2. The Bullish Confirmation Case ($150 Target)
If SPCX achieves three consecutive daily closes above $135, technical models project an extension toward the next psychological resistance level at $150. Such a move would signal that institutional accumulation has completely digested the legacy IPO overhead and the 911.5 million newly unlocked shares.
3. The Bearish Downside Retest ($105–$106 Floor)
Should broader market sentiment deteriorate or interest rate expectations reverse, failure to clear $135 could prompt a consolidation phase. Under this scenario, the stock may retest the established support floor between $105 and $106, which corresponds to the August 6 low touched during the height of the share unlock.
As macroeconomic data continues to shift, institutional desks are closely watching prediction markets and upcoming macroeconomic indicators to gauge discount rate trajectories. For now, SpaceX’s ability to absorb nearly one billion unlocked shares while advancing 22% in five days underscores strong market confidence in its long-term corporate strategy.