Executive Overview
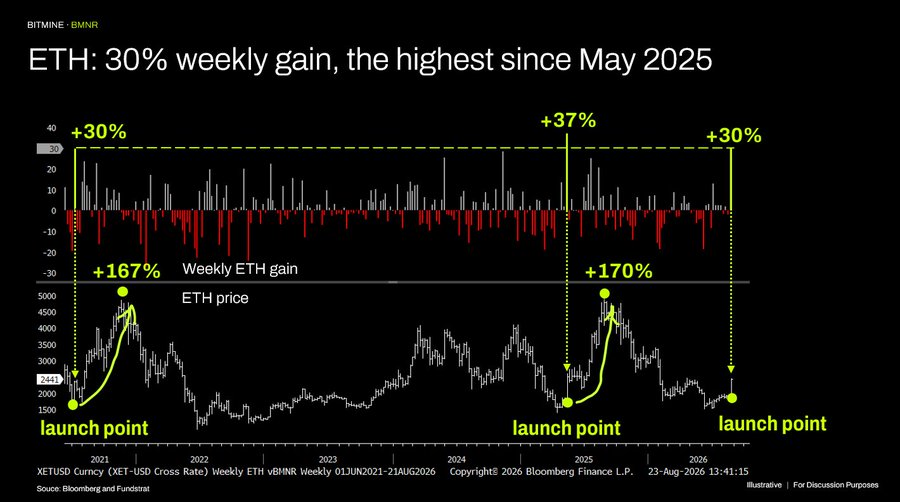
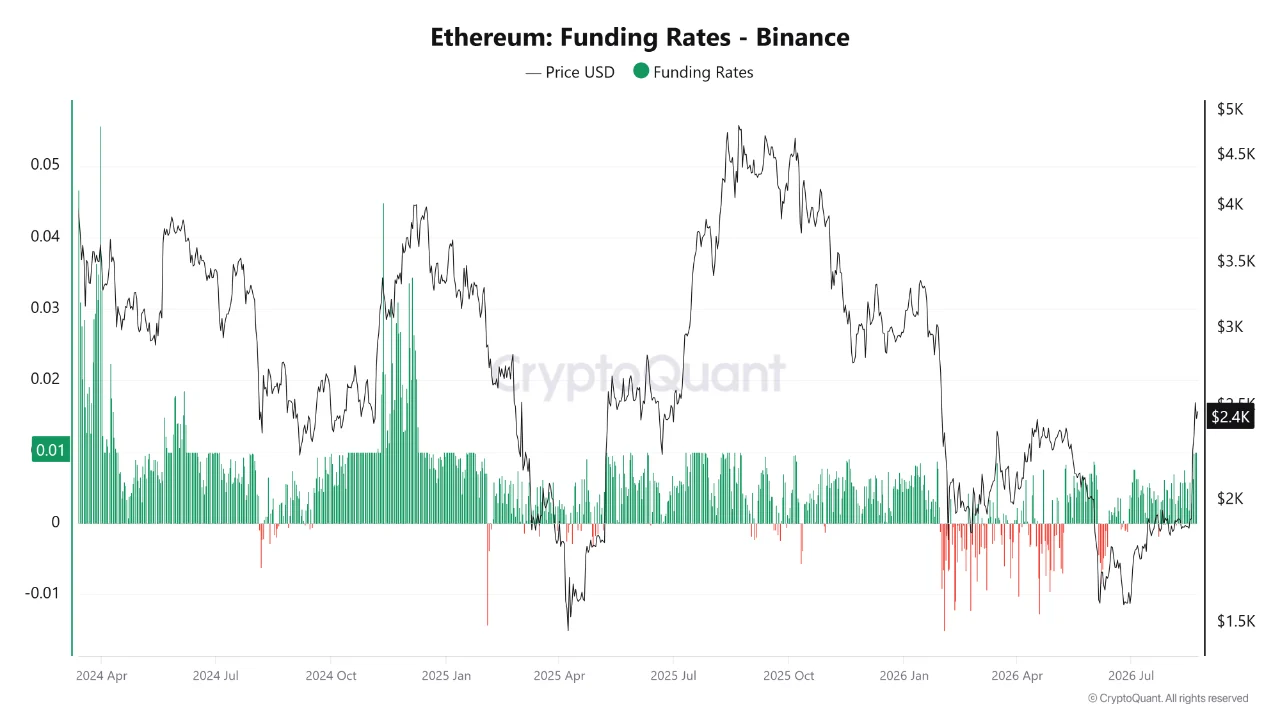
Keying into this emerging setup, Tom Lee, Chairman of digital asset treasury powerhouse Bitmine, publicly highlighted a rare weekly chart pattern that preceded parabolic expansions during previous cycles. Lee’s bullish thesis is reinforced by a pronounced resurgence in institutional capital: spot Ethereum Exchange-Traded Funds (ETFs) recorded $1.06 billion in net monthly inflows in August 2026, marking their most robust performance in twelve months. Concurrently, derivatives positioning on Binance has reached elevated levels, with funding rates climbing to a one-year high.
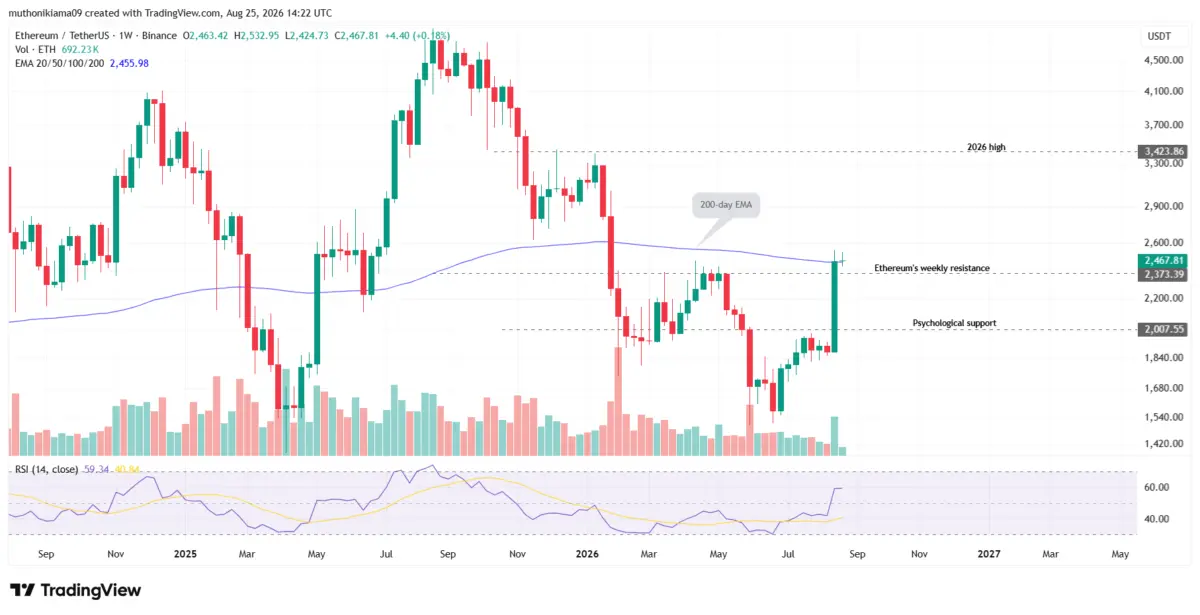
As market participants evaluate whether Ethereum can decisively clear its 200-day Exponential Moving Average (EMA) at $2,455, the convergence of record institutional spot buying, expanding derivatives leverage, and anticipated macroeconomic liquidity injections sets the stage for a critical price discovery phase.
+-----------------------------------------------------------------------------------+
|                        ETHEREUM MACRO SETUP & METRICS SUMMARY                     |
+--------------------------+--------------------------------------------------------+
| Metric / Event           | Data Point / Level                                     |
+--------------------------+--------------------------------------------------------+
| Recent Rally             | +30% expansion from August low                         |
| Immediate Resistance     | 200-day EMA at $2,455 / Psychological $2,500          |
| Key Support Levels       | $2,373 (Weekly Support) / $2,000 (Psychological Floor) |
| Year-to-Date Target      | $3,423 (2026 High)                                     |
| August ETF Net Inflows   | $1.06 Billion (Highest since August 2025)             |
| Total ETF Net Assets     | $14.74 Billion (~4.93% of total ETH market cap)        |
| Binance ETH Funding Rate | 0.01 (1-Year High)                                     |
| Relative Strength Index  | 59.0 (Bullish Momentum Zone)                           |
+--------------------------+--------------------------------------------------------+
Detailed Chronology of the August Surge
The recent upside momentum in Ethereum materialized through a calculated sequence of corporate accumulation, institutional ETF absorption, and technical momentum:

August 17–21, 2026
Bitmine acquires 34,000 ETH (~$79M), initiating strong buy-side pressure.
        |
        v
August 19, 2026
Ethereum bottoms and begins a sharp 30% multi-day advance toward $2,500.
        |
        v
Mid-to-Late August 2026
Spot ETH ETFs register $1.06B in monthly net inflows, led by BlackRock's ETHA ($814M).
        |
        v
August 25, 2026
ETH tests 200-day EMA ($2,455); Binance funding rate reaches a 1-year high (0.01).
Corporate Accumulation (August 17–21)
The groundwork for Ethereum’s rebound was established during mid-August, when corporate treasuries began stepping up spot accumulation. Between August 17 and August 21, Bitmine executed a strategic acquisition of 34,000 ETH (valued at roughly $79 million). This institutional buying absorbed available spot market liquidity, laying the floor for a trend reversal.
The 30% Expansion (August 19 Onward)
Beginning August 19, Ethereum embarked on a 30% price surge, lifting spot prices from local distress levels up toward the $2,500 resistance zone. The advance was characterized by expansive green daily candles and a noticeable uptick in volume across both centralized exchanges and decentralized trading venues.
Derivatives Mobilization and ETF Inflows
As spot prices reclaimed higher ground, perpetual futures markets experienced a leverage buildup. On Binance, the ETH funding rate climbed to 0.01, reaching its highest level since August 2025. Simultaneously, institutional demand poured into regulated vehicles, with United States spot Ethereum ETFs absorbing over $1 billion within the month—confirming that the rally was backed by institutional capital alongside speculative leverage.
Supporting Context & Metrics
Technical Architecture: The 200-Day EMA and RSI
Ethereum’s current price structure reflects a decisive attempt to reclaim long-term trendlines.
Price Level ($)
  3,423 |-------------------------------------------------- [2026 High / Target]
        |
  2,500 |-------------------------------------------------- [Psychological Resistance]
  2,455 |.................................................. [200-Day EMA Resistance]
        |      /=== ETH Spot Price Path
  2,373 |-----/-------------------------------------------- [Crucial Weekly Support]
        |    /
2,000 |---/---------------------------------------------- [Key Floor / Macro Support]- The 200-Day Exponential Moving Average ($2,455): Ethereum recently closed a weekly candle above its 200-day EMA. However, technical analysis standards require three consecutive daily closes above this baseline to validate a structural breakout. A confirmed close above $2,455 opens a path toward the 2026 high of $3,423.
- Support Baselines: If bulls fail to clear the $2,455–$2,500 corridor, immediate structural support sits at the weekly baseline of $2,373. A breakdown below this level would risk a deeper retracement toward the psychological support band at $2,000.
- Relative Strength Index (RSI): The 14-day RSI currently reads 59. While firmly in bullish territory above the neutral 50 line, the indicator has yet to print a higher high relative to previous local peaks. To confirm macro continuation, momentum must push higher without generating bearish divergences.
Derivatives Metrics: Binance Funding Rates and Squeeze Risks
Data from CryptoQuant reveals that Ethereum’s funding rate on Binance—the global benchmark for perpetual futures liquidity—spiked to 0.01.
Binance ETH Perpetual Funding Rate
0.012 |
0.010 |                         /--- 1-Year High (Current: 0.01)
0.008 |                        /
0.006 |                       /
0.004 |      /              /
0.002 |     /  ____________/
0.000 |----+---------------------+--------------------
      Aug 2025                Jan 2026            Aug 2026
A positive funding rate of 0.01 indicates that long position holders are paying a premium to short sellers to keep their leveraged bullish bets open. While this reflects strong trader sentiment, it introduces structural vulnerability. If spot prices encounter supply at $2,500 and drop abruptly, long positions risk cascade liquidations, which could spark a sharp downward squeeze toward key support zones.
Institutional ETF Inflows: Breakdown of Sovereign and Wall Street Capital
Data aggregated by SoSoValue shows that spot Ethereum ETFs recorded $1.06 billion in net monthly inflows during August 2026, marking the single best calendar month for ETH funds since August 2025.
Spot Ethereum ETF Monthly Inflow Distribution (August 2026)
+---------------------------------------+-------------------+
| Fund Issuer / Vehicle                 | Net Inflows ($)   |
+---------------------------------------+-------------------+
| BlackRock iShares Ethereum Trust (ETHA)| $814 Million      |
| Fidelity Ethereum Fund (FETH)         | $81 Million       |
| Other Issuers Combined                | $165 Million      |
+---------------------------------------+-------------------+
| Total August Net Inflows              | $1.06 Billion     |
+---------------------------------------+-------------------+
Total net assets across all US spot Ethereum ETFs reached $14.74 billion, representing approximately 4.93% of Ethereum’s total market capitalization. This institutional footprint reduces the available floating supply on public exchanges, exacerbating supply-demand imbalances during periods of market expansion.
Official Statements and Historical Analogies
Tom Lee on Historical Fractal Patterns
Bitmine Chairman Tom Lee highlighted historical weekly chart setups that mirrored the current technical structure. Following Bitmine’s acquisition of 34,000 ETH, Lee pointed out that Ethereum recently completed one of its strongest weekly green candles since May 2025.
Historical Post-Candle Rally Performance
July 2021 Expansion:  [========================================] +167%
May 2025 Expansion:   [========================================] +170%
2026 Target Horizon:  [=========================> ? ] (Projected Re-test of $3,423+)
Evaluating these historical fractals, Lee noted:
- The July 2021 Precedent: A similar weekly candle configuration in July 2021 catalyzed a sustained 167% rally over subsequent months.
- The May 2025 Precedent: A virtually identical weekly structure in May 2025 resulted in a 170% price expansion.
Lee emphasized that macro conditions could catalyze a similar move. Specifically, he pointed to potential $1 trillion US Treasury bond buyback initiatives, designed to inject liquidity into the banking system. This expansion of global M2 money supply historically correlates with increased demand for non-sovereign risk assets, with Ethereum serving as a primary beneficiary.
On-Chain & Analytics Commentary
CryptoQuant analyst Arab Chain evaluated the surge in derivatives activity, noting that the elevated funding rates are occurring alongside genuine spot market demand. According to Arab Chain’s assessment, improved institutional risk appetite is driving capital into spot vehicles rather than purely speculative leverage. However, the analyst cautioned that market participants should monitor leverage ratios closely to prevent over-extension ahead of key resistance tests.

Future Outlook & Strategic Implications
As Ethereum hovers beneath the $2,500 mark, market participants face two distinct structural scenarios over the coming trading sessions:
                  +----------------------------------+
                  |  ETH Price Testing $2,455-$2,500 |
                  +----------------------------------+
                                   |
                  +----------------+----------------+
                  |                                 |
                  v                                 v
        [BULLISH BREAKOUT]                [REJECTION & RETRACEMENT]
  - 3 Consecutive Closes > 200-day EMA   - Failure at $2,455 - $2,500
  - ETF Inflows Maintain > $1B Pace      - Derivatives Liquidation Flush
  - Macro Liquidity Expansion            - RSI Bearish Divergence
                  |                                 |
                  v                                 v
   Target: $3,423 (2026 Highs)            Support: $2,373 then $2,000
The Bullish Case: Structural Breakout to $3,423
For the bullish scenario to materialize, Ethereum must secure three consecutive daily closes above the 200-day EMA at $2,455 and push decisively past $2,500. Under this scenario:
- Supply Absorption: Sustained ETF inflows (averaging over $1 billion monthly) continue to lock up spot circulating supply.
- Macro Windfalls: Expected Treasury liquidity programs expand market liquidity, driving capital into smart contract platforms.
- Upside Target: Clearing $2,500 establishes a technical path toward the 2026 high of $3,423, representing a potential ~37% gain from current levels.
The Bearish Case: Leverage Flush to $2,000
Conversely, if overhead supply near $2,500 caps further upside, a localized correction may unfold:
- Long Squeeze Trigger: With Binance funding rates at a one-year high, a sudden pullback below $2,373 could trigger a cascade of long liquidations.
- Downside Target: A breakdown below weekly support at $2,373 would likely shift short-term momentum back to bears, exposing the $2,000 psychological floor.
Conclusion
Ethereum sits at a technical inflection point. Backed by corporate accumulation from entities like Bitmine, monthly ETF inflows exceeding $1 billion, and favorable macroeconomic tailwinds, the structural foundation for an upward expansion remains active. However, traders must navigate near-term derivatives leverage and demand clear confirmation above the 200-day EMA before anticipating a full re-test of 2026 highs.