Executive Overview
Crucially, this price action coincides with a sharp influx of capital into spot XRP exchange-traded funds (ETFs) operating in the United States. Institutional vehicles logged $39.8 million in net weekly inflows across four consecutive sessions—the highest level of capital absorption registered since mid-May. This institutional bid has effectively elevated total ETF net assets to $1.33 billion, representing roughly 1.54% of XRP’s total market capitalization.
The rally comes against the backdrop of a broader crypto market recovery. Total market capitalization expanded by 1.61% over a 24-hour period to reach approximately $2.62 trillion, supported by Bitcoin maintaining structural integrity above $77,000 and Ethereum holding near $2,400. While macro sentiment metrics such as the Crypto Fear and Greed Index remain anchored deep within the "greed" territory, technical indicators on shorter timeframes—including momentum oscillators and moving average convergence divergence (MACD) lines—suggest that XRP is navigating a critical retest of its key $1.40 support level.
+-------------------------------------------------------------------------+
|                    XRP SPOT ETF INFLOW HIGHLIGHTS                       |
+------------------------------------+------------------------------------+
| 4-Day Net Inflow Streak            | +$39.8 Million                     |
| Single-Day Peak (Aug 21)           | +$18.38 Million                    |
| Listed Product Trading Volume      | $94.03 Million                     |
| Total ETF Net Assets               | $1.33 Billion                      |
| Cumulative Inflows Since Launch    | $1.55 Billion                      |
| Share of Total XRP Market Value    | ~1.54%                             |
+------------------------------------+------------------------------------+
Detailed Chronology of the Rally and Institutional Inflows
The trajectory of XRP’s latest market cycle illustrates a clear transition from speculative retail momentum to structured institutional absorption.
[Early Phase]                [Mid-Week Expansion]          [Consolidation Phase]
XRP breaks structural        Daily ETF inflows reach       Profit-taking pulls price
base below $1.10.            $18.38M on Aug 21; price      from $1.60 back to $1.47;
Rapid 50% weekly surge. peaks at $1.60. holds $1.40 key support.- Initial Momentum and Breakout: The token initiated its violent upward move from lower multi-week support bands, breaking through overhead technical resistance to orchestrate a 50% rally. Driven by high spot volume across global exchanges, XRP surged to a peak of $1.60.
- Accelerated Institutional Buying (August 21): During the mid-week session, institutional capital flows accelerated aggressively. On August 21 alone, U.S. spot XRP ETFs recorded a daily net inflow of $18.38 million. Trading volume across these regulated investment vehicles surged to $94.03 million, pointing to elevated liquidity depth and active portfolio rebalancing by institutional asset managers.
- Four-Day Net Inflow Streak: The August 21 surge marked the anchor for a continuous four-day net positive inflow cycle, generating cumulative weekly net inflows of $39.8 million. This capital surge represented the largest weekly allocation into spot XRP funds since the record-setting week of mid-May, when institutional vehicles captured approximately $60.5 million.
- Market Cooling and Local Peak: Upon testing the $1.60 psychological resistance line, aggressive short-term distribution triggered a pullback. XRP retraced toward $1.45 before establishing a interim trading equilibrium around $1.47.
Supporting Context and Quantitative Metrics
To understand the durability of XRP’s price movement, market analysts evaluate both the structural metrics underlying ETF vehicles and the macro context of the broader digital asset economy.
ETF Microstructure and Market Share Dynamics
The spot XRP ETF landscape has grown into a major driver of price discovery. Cumulative net inflows since the inception of these spot products have surpassed $1.55 billion, building total asset under management (AUM) to $1.33 billion.
  Total XRP Market Cap: ~$95.5 Billion
  -------------------------------------------------------------
  [==================================================] 100%
  [===] Spot ETF AUM: $1.33 Billion (1.54%)
Holding 1.54% of XRP’s total circulating market value within regulated institutional wrappers creates a structural lockup mechanism. As asset managers accumulate physical XRP to back trust shares, the circulating liquid supply on central exchange order books contracts. When demand surges simultaneously in both spot and derivatives markets, reduced supply depth tends to amplify price volatility to the upside.

Macro Crypto Market Landscape and Sentiment Indicators
XRP’s performance is not occurring in isolation; it unfolds within an improving digital asset macro environment:
- Global Cryptocurrency Market Cap: Reached $2.62 trillion, expanding 1.61% over a 24-hour window.
- Bitcoin (BTC): Remained firmly anchored above the $77,000 psychological barrier, providing structural stability to altcoin valuations.
- Ethereum (ETH): Maintained its consolidation platform around $2,400, reflecting sustained ecosystem engagement.
- Fear & Greed Index: Positioned in the "Greed" regime (ranging near 79/100), signaling elevated market participant confidence, robust retail engagement, and an expansion of risk appetite across asset classes.
Investors are actively positioning ahead of broader macroeconomic data, including U.S. Personal Consumption Expenditures (PCE) inflation figures, employment updates, and revised GDP growth metrics, all of which continue to shape expectations for global liquidity conditions.
Technical Analysis: Evaluating Momentum and Chart Microstructure
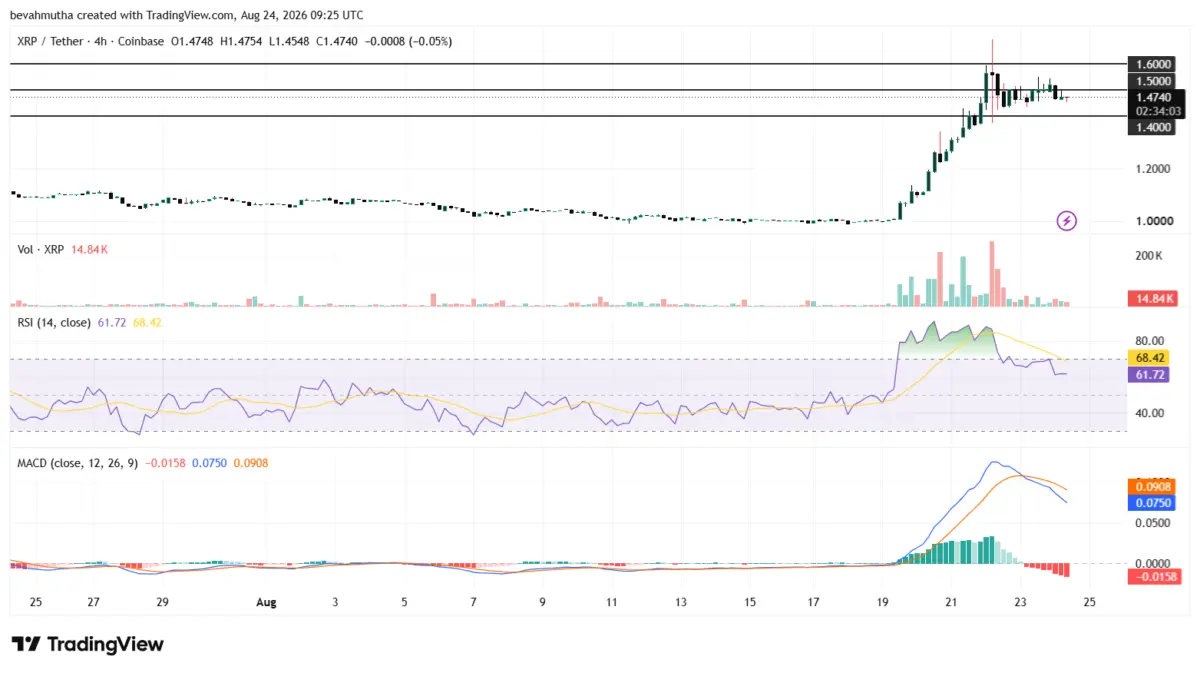
A granular technical evaluation of the XRP/USDT 4-hour chart reveals a market transitioning from an overextended impulse phase into an organized re-accumulation or distribution structure.
       [Resistance Levels]
       $1.80  ----------------------------------- Target 3
       $1.70  ----------------------------------- Target 2
       $1.60  ----------------------------------- Local Peak / Key Barrier
       $1.50  ----------------------------------- Immediate Breakout Resistance

       [Current Price Action]
       $1.47  ==> Current Equilibrium Zone

       [Support Levels]
       $1.40  =================================== Primary Trend-line Support
       $1.30  ----------------------------------- Secondary Support
       $1.20  ----------------------------------- Major Defensive Zone
Key Support Boundaries: The Defense of $1.40
The $1.40 price floor stands as the decisive line in the sand for bullish market structure. This level marks a historic confluence of previous horizontal resistance turned support, alongside key moving average clusters on intermediate timeframes.
- Primary Defensive Zone ($1.40): A successful defense of $1.40 confirms that the recent retrace is merely a routine cooling phase within an ongoing macro uptrend.
- Secondary Breakdown Levels ($1.30 and $1.20): Should selling pressure breach $1.40, liquidations of over-leveraged long positions could push prices toward $1.30. A deeper correction down to $1.20 would test the structural integrity of the entire post-breakout rally.
Resistance Targets and Oscillators
On the upside, buyers face distinct structural hurdles:
- Immediate Resistance ($1.50 – $1.60): Reclaiming $1.50 is required to initiate a retest of the local high at $1.60.
- Expansion Targets ($1.70 – $1.80): A high-volume breach above $1.60 opens the path to tests of $1.70 and $1.80.
+-------------------------------------------------------------------------+
|                      TECHNICAL INDICATOR SUMMARY                        |
+----------------------+-------------------+------------------------------+
| Metric               | Current Value     | Signal / Interpretation      |
+----------------------+-------------------+------------------------------+
| Relative Strength    | 58.80             | Moderately Bullish           |
| Index (RSI 4-Hour)   |                   | (Cooled from Overbought >70) |
|                      |                   |                              |
| MACD Histogram       | -0.0170           | Short-Term Bearish Pressure  |
|                      |                   | (Bearish Crossover Signal)   |
|                      |                   |                              |
| Key Support Floor    | $1.40             | Critical Bull/Bear Boundary  |
| Primary Resistance   | $1.60             | Local Peak / Supply Zone     |
+----------------------+-------------------+------------------------------+- Relative Strength Index (RSI): The 4-hour RSI has cooled to 58.80 after previously breaching overbought territory above 70 during the peak of the surge to $1.60. While this drop indicates that buying momentum has moderated, an RSI sitting near 58 remains firmly within constructivist, moderately bullish territory, leaving room for further upside without triggering immediate overbought warnings.
- MACD Dynamics: The Moving Average Convergence Divergence indicator reveals a short-term momentum shift. The MACD line crossed beneath its signal line, accompanied by a negative histogram value of -0.0170. This bearish crossover confirms active near-term consolidation and highlights the risk of ongoing selling pressure until a bullish realignment occurs.
Industry Perspectives and Market Commentary
Market observers and quantitative tracking firms point to the divergence between short-term technical indicators and underlying institutional capital flows as a core narrative.
According to updates published by market analysis platform BSCN citing Sosovalue institutional data:

"Spot XRP ETFs just saw their best week since May. Spot Ripple ETFs are on a four-day net inflow streak, recording a staggering +$39.8M in net inflows this past week. This is the biggest single-week net inflow the ETFs have seen since mid-May…"
Institutional analysts emphasize that while retail-driven trading on derivative markets can cause sharp, short-term liquidation cascades, spot ETF inflows reflect committed, medium-to-long-term capital. The entry of regulated, institutional-grade exchange-traded products offers institutional investors a liquid vehicle for accumulating XRP exposure without direct self-custody operational risks.
Furthermore, analysts point out that sustained inflows during periods of price consolidation suggest asset managers are actively using price dips as strategic accumulation windows, absorbing liquidity sold off by short-term traders taking profits.
Future Outlook and Strategic Market Scenarios
Moving into subsequent trading sessions, XRP stands at a pivotal technical junction. Market participants are preparing for two distinct macro-technical scenarios.
                        +----------------------------+
                        |  XRP Price Action Options  |
                        +----------------------------+
                                      |
                 +--------------------+--------------------+
                 |                                         |
                 v                                         v
   +---------------------------+             +---------------------------+
   |  BULLISH PATHWAY          |             |  BEARISH PATHWAY          |
   |                           |             |                           |
   | • Holds $1.40 Support     |             | • Breaches $1.40 Floor    |
   | • Reclaims $1.50          |             | • Retests $1.30 Zone      |
   | • Drives through $1.60    |             | • Extended Drop to $1.20   |
   | • Targets $1.70 - $1.80   |             | • ETF Inflows Stall       |
   +---------------------------+             +---------------------------+
The Bullish Case: Defense of Support and Target Expansion
If buyers continue to defend the $1.40 support level and spot ETF net inflows persist at multi-million-dollar daily rates, the temporary momentum cool-down will likely resolve to the upside.
- A decisive daily close above $1.50 would confirm buyers have regained control of short-term price discovery.
- Clearing $1.60 on expanding spot volumes would clear overhead resistance, setting up a momentum push toward $1.70 and $1.80.
- Sustained broader market strength—specifically Bitcoin pushing into new valuation ranges—would accelerate this bullish resolution.
The Bearish Case: Support Failure and Deeper Correction
Conversely, should broader macro sentiment deteriorate or profit-taking intensify among large holders, XRP risks breaking below its critical structural anchor.
- A breakdown below $1.40 would invalidate the immediate bullish continuation setup, exposing the market to an extended retracement toward $1.30.
- If sustained selling breaches $1.30, the next major historical liquidity pocket rests around $1.20.
- A prolonged period below these levels would likely coincide with a deceleration in spot ETF inflows, signaling an extended phase of range-bound consolidation before any renewed upward expansion.
Ultimately, the structural interaction between traditional capital flowing through ETF rails and technical support at $1.40 will dictate whether XRP’s 50% weekly surge is the foundation of a macro trend or a temporary volatility spike.